Francis Rouessac - Chemical Analysis
Здесь есть возможность читать онлайн «Francis Rouessac - Chemical Analysis» — ознакомительный отрывок электронной книги совершенно бесплатно, а после прочтения отрывка купить полную версию. В некоторых случаях можно слушать аудио, скачать через торрент в формате fb2 и присутствует краткое содержание. Жанр: unrecognised, на английском языке. Описание произведения, (предисловие) а так же отзывы посетителей доступны на портале библиотеки ЛибКат.
- Название:Chemical Analysis
- Автор:
- Жанр:
- Год:неизвестен
- ISBN:нет данных
- Рейтинг книги:3 / 5. Голосов: 1
-
Избранное:Добавить в избранное
- Отзывы:
-
Ваша оценка:
Chemical Analysis: краткое содержание, описание и аннотация
Предлагаем к чтению аннотацию, описание, краткое содержание или предисловие (зависит от того, что написал сам автор книги «Chemical Analysis»). Если вы не нашли необходимую информацию о книге — напишите в комментариях, мы постараемся отыскать её.
provides an up-to-date overview of the common methods used for qualitative, quantitative, and structural chemical analysis. Assuming no background knowledge in the subject, this student-friendly textbook covers the fundamental principles and practical aspects of more than 20 separation and spectroscopic methods, as well as other important techniques such as elemental analysis, electrochemistry and isotopic labelling methods.
Avoiding technical complexity and theoretical depth, clear and accessible chapters explain the basic concepts of each method and its corresponding instrumental techniques—supported by explanatory diagrams, illustrations, and photographs of commercial instruments. The new edition includes revised coverage of recent developments in supercritical fluid chromatography, capillary electrophoresis, miniaturized sensors, automatic analyzers, digitization and computing power, and more. Offering a well-balanced introduction to a wide range of analytical and instrumentation techniques, this textbook:
Provides a detailed overview of analysis methods used in the chemical and agri-food industries, medical analysis laboratories, and environmental sciences Covers various separation methods including chromatography, electrophoresis and electrochromatography Describes UV and infrared spectroscopy, fluorimetry and chemiluminescence, x-ray fluorescence, nuclear magnetic resonance and other common spectrometric methods such atomic or flame emission, atomic absorption and mass spectrometry Includes concise overview chapters on the general aspects of chromatography, sample preparation strategies, and basic statistical parameters Features examples, end-of-chapter problems with solutions, and a companion website featuring PowerPoint slides for instructors
, is the perfect textbook for undergraduates taking introductory courses in instrumental analytical chemistry, students in chemistry, pharmacy, biochemistry, and environmental science programs looking for information on the techniques and instruments available, and industry technicians working with problems of chemical analysis.
Review of Second Edition “An essential introduction to a wide range of analytical and instrumentation techniques that have been developed and improved in recent years.”
–
Chemical Analysis — читать онлайн ознакомительный отрывок
Ниже представлен текст книги, разбитый по страницам. Система сохранения места последней прочитанной страницы, позволяет с удобством читать онлайн бесплатно книгу «Chemical Analysis», без необходимости каждый раз заново искать на чём Вы остановились. Поставьте закладку, и сможете в любой момент перейти на страницу, на которой закончили чтение.
Интервал:
Закладка:
Unlike the direct process, this process consists in creating a chemical reaction between the analyte and a chiral reagent, prior to the injection, to form diastereomers. As these have different physical properties, they should be separable with conventional phases. This longer process is not used as often as the direct one. It may cause a partial racemization of the analyte.
Chiral stationary phases for GC are mainly obtained from cyclodextrins ( Figure 2.10), ring‐shaped macromolecules composed of six, seven or eight units of D (+)‐glucose. They look like cones, with a hydrophobic central cavity, which enables the selective and reversible inclusion of a large variety of compounds, such as diastereomeric complexes.
After possible chemical transformation, cyclodextrins are either deposited on the internal surface of the capillary column or incorporated into a poly(dimethylsiloxane)‐type polymer or grafted onto the silanol functions of silica via a short carbonated chain. These can be used up to 200°C. Above this temperature, analytes can racemize.
As a reminder, the other chiral vectors for GC, much less in use, are crown ethers and some asymmetrical diamides, which are progressively being abandoned ( Figure 2.10).
2.6.5 Solid Stationary Phases
These phases are made from a variety of adsorbent materials: silica or alumina deactivated by mineral salts, molecular sieves 5 Å (0.5 nm), porous glass or polymers, or graphite (e.g. Chromosorb ®100, Porapak ®). Capillary columns made by deposition of these materials in the form of a fine porous uniform layer are called PLOT. They are employed to separate gaseous or highly volatile samples. Columns containing graphitized carbon black have been developed for the separation of N 2, CO, CO 2, and very light hydrocarbons. The efficiency of these columns is very high ( Figure 2.11).
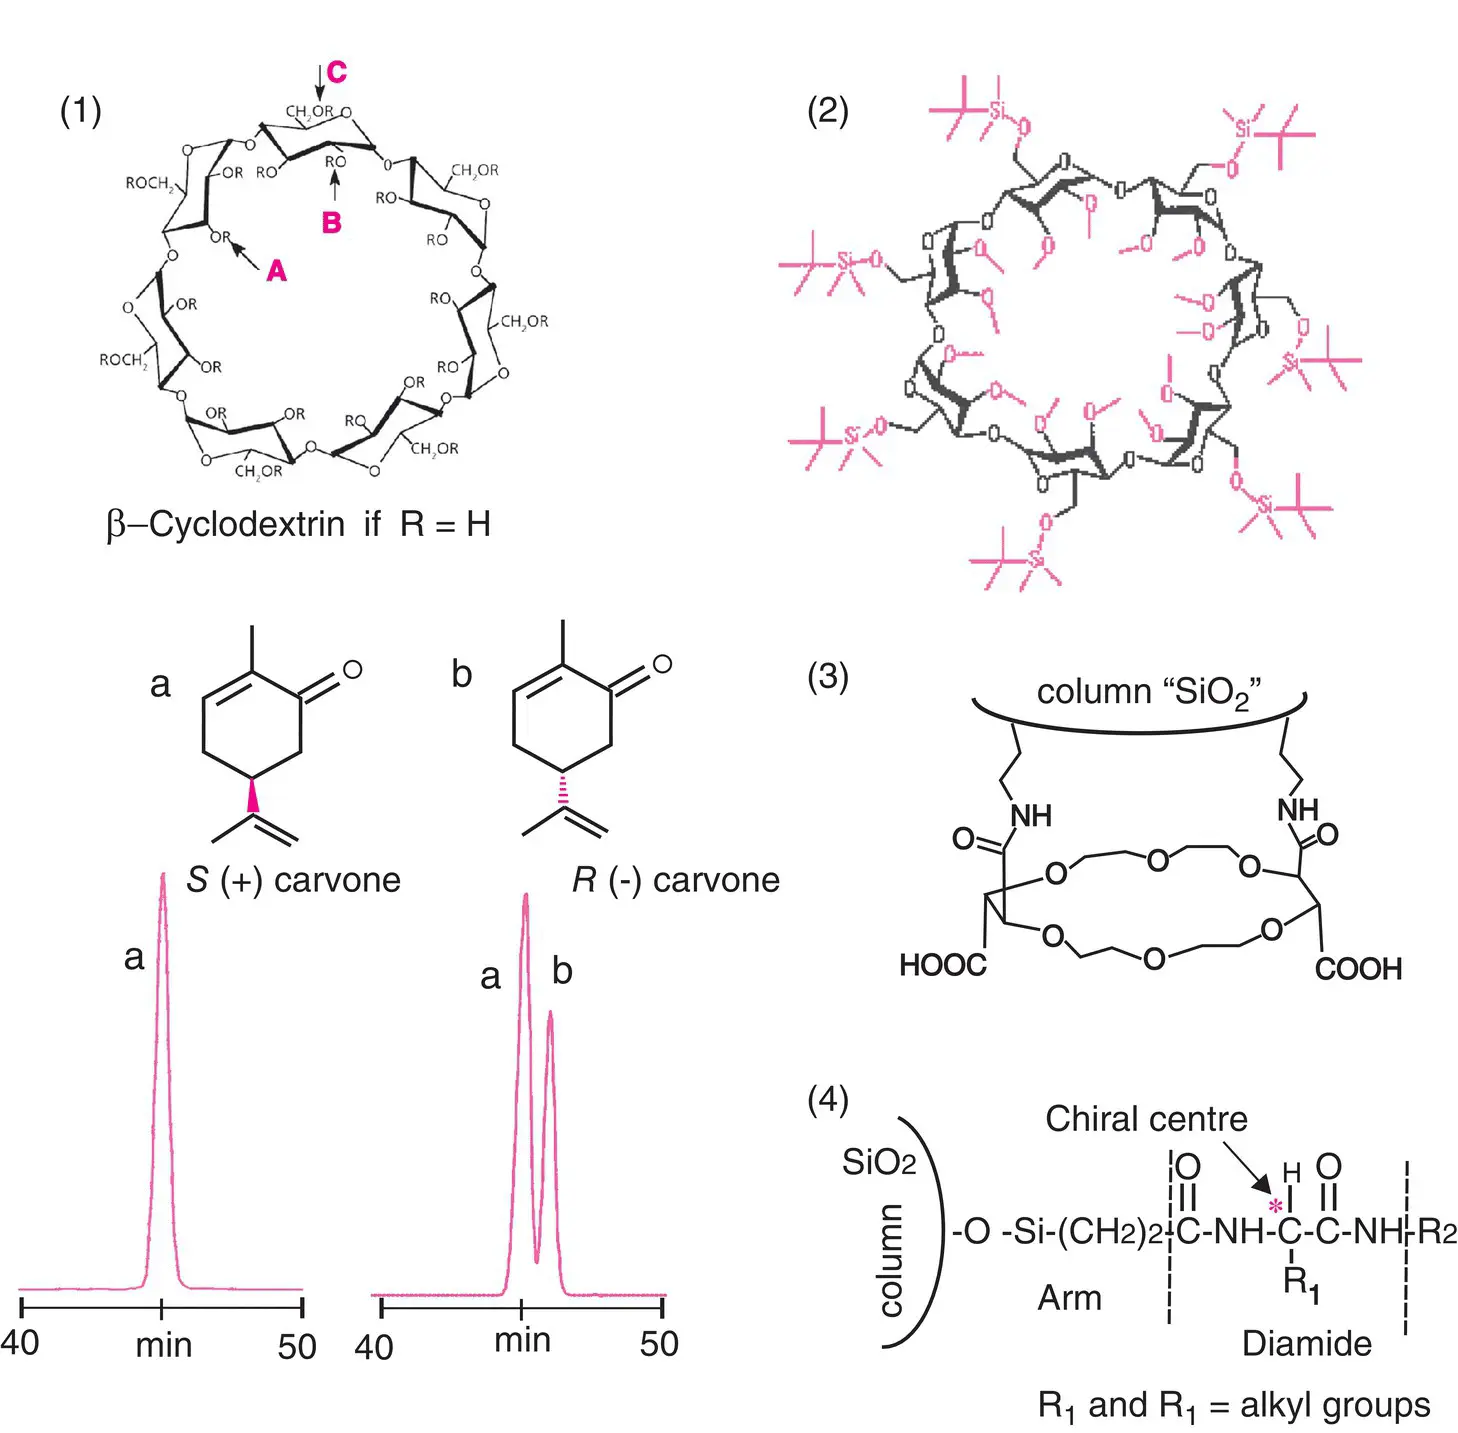
Figure 2.10 Chiral stationary phase in GC. Among the three chiral vectors encountered in GC ( 1 and 2, β ‐cyclodextrins, 3, crown ethers, 4, diamides), cyclodextrins are by far the most commonly used. They include three types of sites: A, axial hydroxyl, B, equatorial hydroxyl and C,hydroxymethyl. Their reactivities are sufficiently different to enable selective reactions and thus obtain some 50 phases (e.g. 2, ungrafted cycloSil‐B phase from Chromoptic). Partial chromatograms of natural extracts, demonstrating the separation of optical isomers of carvone.
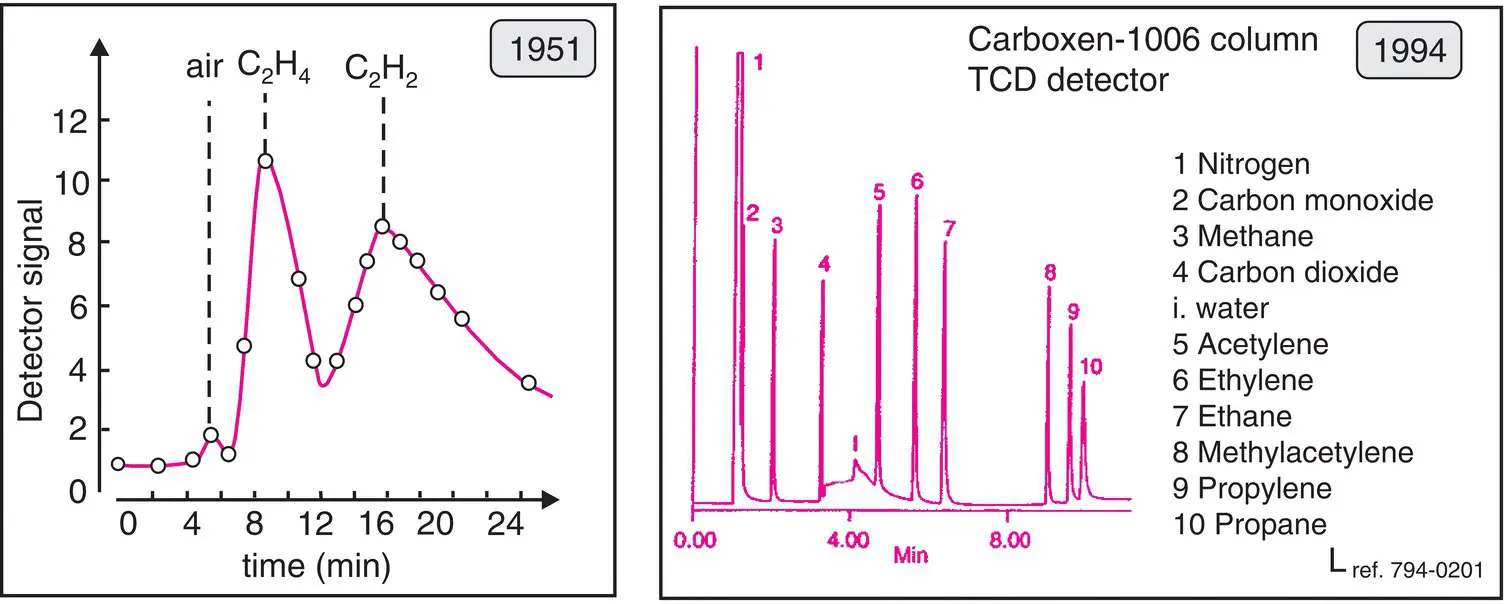
Figure 2.11 Gas analyses. Left, one of the earliest ever chromatograms, obtained point by point and representing a mixture of air, ethylene and acetylene separated on silica gel (E. Cremer and F. Prior, Z. Elektrochem . 1951, 55, 66). Right, an analysis of gas on a modern PLOT column (reproduced courtesy of Supelco).
Historically, silica gel, a thermostable material that is insensitive to oxygen, was one of the first compounds to serve as a stationary phase for GC columns ( Figure 2.11). Today, solid phases have become much more elaborate.
2.7 MAIN DETECTORS
Downstream from the column, the chromatograph has one last device: the detector, which provides a signal with the passage of each analyte. All of the signals will form the chromatogram. This detector uses variations in physical amplitude related to the presence of a solute, in addition to that of the carrier gas. Some detectors are universal ; that is they are sensitive to practically every solute, while others are selective detectors that are sensitive only to specific compounds ( Figure 2.14). The most effective rely on the adaptation of spectral methods, or on mass spectrometry, which not only helps generate the conventional chromatogram but also helps identify each solute (see the Chapter 16on Mass Spectrometry). Nevertheless, this is expensive, and we always find a number of conventional detectors in laboratories.
2.7.1 Universal or Near‐Universal Detectors
Flame ionization detector (FID)
Considered as almost universal for organic compounds, this is the detector par excellence for GC. The gas flow issuing from the column passes through the flame of a small burner fed by a mixture of hydrogen and air. When a compound is eluted, its combustion results in the release of ions and charged particles responsible for the passage of a very weak current (10 −12μA) between two electrodes (p.d. of 100–300 V). The signal is transformed by an electrometer into a measurable voltage ( Figure 2.12). One end of the burner, held at ground potential, acts as a polarization (ground) electrode, while the ring‐shaped second electrode surrounds the flame.
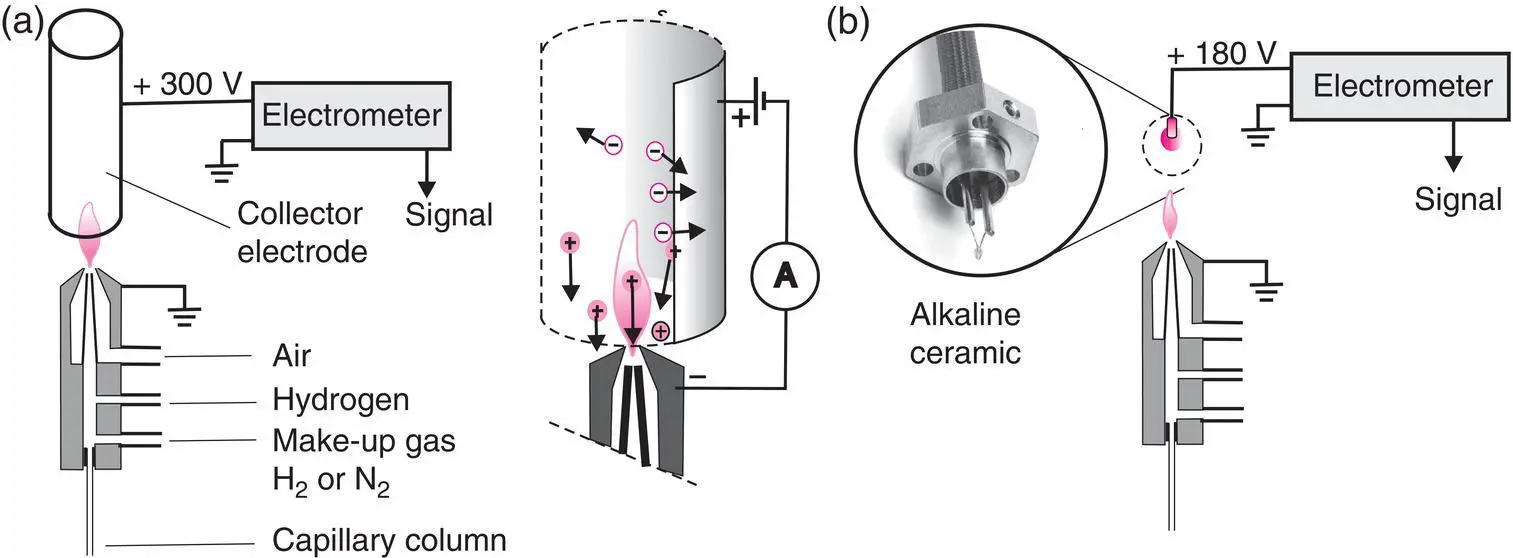
Figure 2.12 FID detector (a) and NPD detector (b). The make‐up gas (or filling gas) is useful when the flow rate of the capillary column is too small. The electrometers used with detectors enable the measurement of intensities that would too small for a galvanometer. Many variants exist depending on the manufacturer.
(Source (a): Modified from Cremer, E. and Prior, F. (1951), Anwendung der chromatographischen Methode zur Trennung von Gasen und zur Bestimmung von Adsorptionsenergien. Zeitschrift für Elektrochemie und angewandte physikalische Chemie , 55, 66–70. https://doi.org/10.1002/bbpc.19510550115. (b): Courtesy of Supelco.)
For organic compounds, the intensity of the signal is sensitive to the mass flow of the sample, except in the presence of heteroelements, such as halogens. The latter may change the response and several simple compounds, such as water, carbon dioxide or ammonia, do not give any response. Thus, the area under the peak reflects the mass m of the compound eluted (d m/ d t integrated between the beginning and end of the peak). An FID detector is not affected by variations in flow rate, which can lead to errors with some types of detectors. The sensitivity of this detector is expressed in Coulombs/g of carbon, and the dead volume of the detector is null. The detection limit is in the order of 2 or 3 pg/s, and the linear dynamic range reaches 10 8; however, concentrated solutions do not lead to the best resolution.
To evaluate the overall quantity of volatile organic compounds (VOCs) in polluted air, there exist small portable instruments housing a flame ionization detector that allows the measurement of the carbon factor of the atmosphere examined, without prior chromatographic separation.
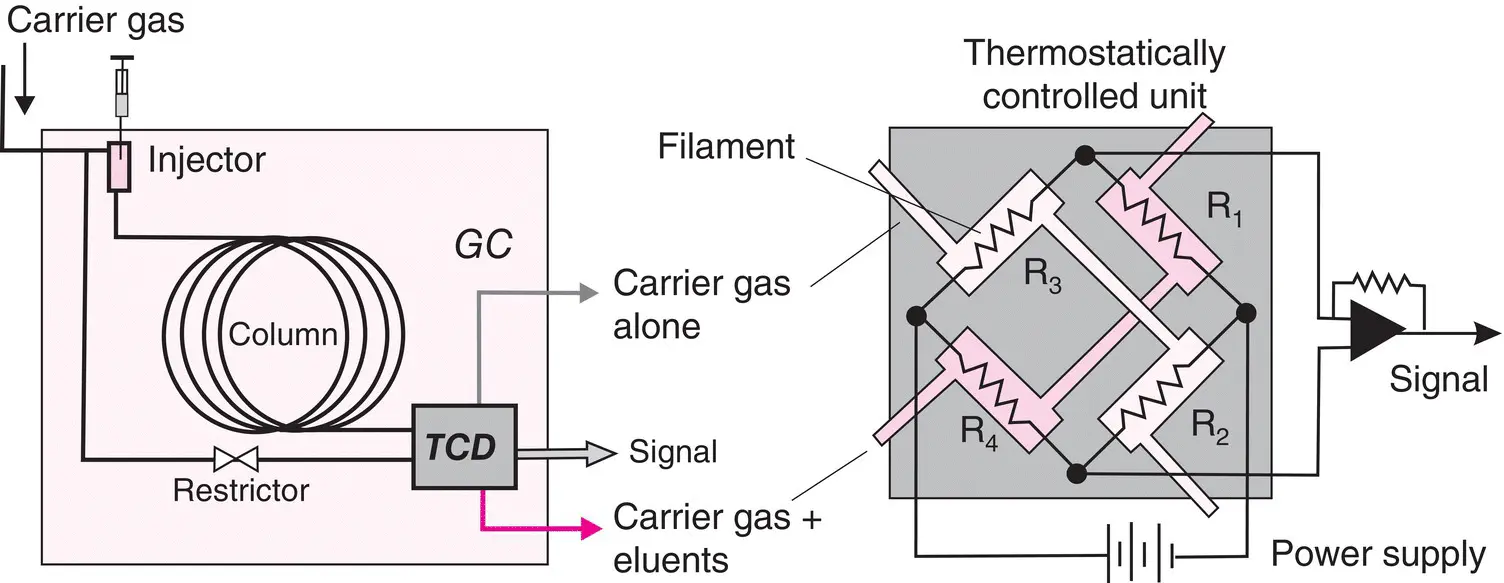
Figure 2.13 Thermal conductivity detector. Left, layout demonstrating the dual circulation of the carrier gas. Right, a katharometer unit with the principle of its electrical connections in a Wheatstone bridge type assembly.
Thermal conductivity detector (TCD)
This universal detector, developed in the early days of GC for packed columns, is still in use now. Easy to build, it exists in a number of variants ( Figure 2.13), including miniaturized forms (μ‐TCD) for capillary columns.
Читать дальшеИнтервал:
Закладка:
Похожие книги на «Chemical Analysis»
Представляем Вашему вниманию похожие книги на «Chemical Analysis» списком для выбора. Мы отобрали схожую по названию и смыслу литературу в надежде предоставить читателям больше вариантов отыскать новые, интересные, ещё непрочитанные произведения.


![Евгений Матерёв - Музеи… или вдохновляющая музыка The Chemical Brothers [litres самиздат]](/books/437288/evgenij-materev-muzei-ili-vdohnovlyayuchaya-muzyka-th-thumb.webp)


Обсуждение, отзывы о книге «Chemical Analysis» и просто собственные мнения читателей. Оставьте ваши комментарии, напишите, что Вы думаете о произведении, его смысле или главных героях. Укажите что конкретно понравилось, а что нет, и почему Вы так считаете.