Joel P. Dunsmore - Handbook of Microwave Component Measurements
Здесь есть возможность читать онлайн «Joel P. Dunsmore - Handbook of Microwave Component Measurements» — ознакомительный отрывок электронной книги совершенно бесплатно, а после прочтения отрывка купить полную версию. В некоторых случаях можно слушать аудио, скачать через торрент в формате fb2 и присутствует краткое содержание. Жанр: unrecognised, на английском языке. Описание произведения, (предисловие) а так же отзывы посетителей доступны на портале библиотеки ЛибКат.

- Название:Handbook of Microwave Component Measurements
- Автор:
- Жанр:
- Год:неизвестен
- ISBN:нет данных
- Рейтинг книги:5 / 5. Голосов: 1
-
Избранное:Добавить в избранное
- Отзывы:
-
Ваша оценка:
Handbook of Microwave Component Measurements: краткое содержание, описание и аннотация
Предлагаем к чтению аннотацию, описание, краткое содержание или предисловие (зависит от того, что написал сам автор книги «Handbook of Microwave Component Measurements»). Если вы не нашли необходимую информацию о книге — напишите в комментариях, мы постараемся отыскать её.
Handbook of Microwave Component Measurements — читать онлайн ознакомительный отрывок
Ниже представлен текст книги, разбитый по страницам. Система сохранения места последней прочитанной страницы, позволяет с удобством читать онлайн бесплатно книгу «Handbook of Microwave Component Measurements», без необходимости каждый раз заново искать на чём Вы остановились. Поставьте закладку, и сможете в любой момент перейти на страницу, на которой закончили чтение.
Интервал:
Закладка:
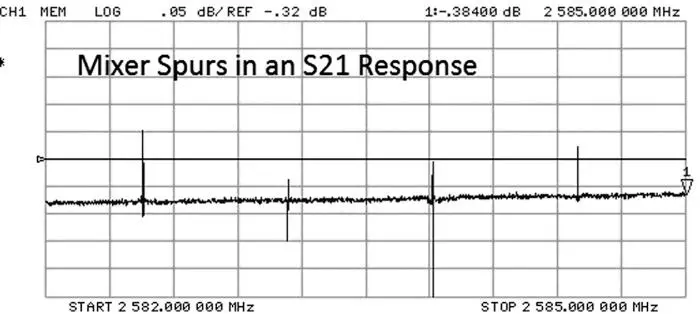
Figure 2.22 Spurs from a source crossing a harmonic of the VCO.
Another difficulty with sampling mixers becomes apparent when measuring filters in the stopband and is caused by remixing signals reflected off the DUT back into the input reflection receiver such as the b1 receiver. Because this effect has the appearance of a signal bouncing off the input reflection of the filter stopband and then bouncing off the b1 mixer (at a different frequency), it is sometimes called sampler bounce ( or mixer bounce in the case of mixers). Designs of these components must be carefully considered to avoid these bounce signals, and the basic design of samplers make them especially susceptible to this particular type of crosstalk.
For these reasons, and the fact that creating wideband mixers with full‐band RF‐frequency LOs has become much more cost effective, the use of samplers in VNAs has been phased out.
2.2.5.2 Mixers
Almost exclusively, modern VNAs use mixers as VNA receivers. The mixers are driven by a fundamental or low‐harmonic‐order LO. This provides a much larger conduction angle for frequency conversion and as such provides a lower noise floor. The trade‐off, of course, is the cost of the LO, which may be due to its increased complexity.
2.2.5.3 Noise Floor
With mixers used as VNA receivers, the critical performance attributes are noise floor and input compression point. A fundamental LO provides best performance; using a third‐order harmonic of the LO to obtain higher RF frequency response theoretically degrades the conversion loss by 9 dB, and fifth harmonic degrades it by 14 dB, based the idea that the LO drives the mixer into square‐wave conversion. This degradation in conversion loss is represented as an increase in noise floor for most VNAs, due to the internal factory‐based response correction.
2.2.5.4 Spurious Responses
Mixers have much lower unwanted spurious responses compared to sampler‐based receivers. The primary spurious (or unintended) conversion occurs at the IF image of the desired RF signal. If the RF is above the LO (low‐side mixing), the image will be one IF below the LO (hi‐side mixing). Because mixers used as VNA receivers have lower noise floor and lower spurious responses, a much wider class of measurements that can be performed including noise figure, two‐tone IMD, and even some modulated measurements.
2.2.5.5 Phase Noise
The LO distribution attributes are critical in the performance of mixer‐based systems. The phase noise of the LO contributes directly to errors (primarily trace noise) in the phase of the measured signal. Even the trace noise of the amplitude response can be degraded by phase noise as the signal moves across the IF bandwidth filter. Providing a common and coherent LO to all the mixers improves the trace noise of the measurement by allowing the effects of LO phase noise to be reduced when the measured parameter is a ratio, such as gain or return loss.
2.2.5.6 Isolation and Crosstalk
Isolation between VNA receivers is important when measuring high‐dynamic‐range devices such as filters. In almost all measurements, the reference path has a large signal (as it measures the incident wave) and so is a constant source of leakage signals. Partly for this reason, it is common to provide additional loss in front of the reference channel mixer (5 or 10 dB) to lower the incident signal level and provide greater reverse isolation for mixer bounce. This also helps to keep the reference channel mixer operating in its linear region for higher source power signals, avoiding compression in the reference mixer.
In fact, there are four primary crosstalk paths in VNAs, listed here:
1 RF signal from the internal source or reference receiver to the transmission test port. This crosstalk signal is independent of the DUT characteristics, and its level remains constant regardless of the DUT properties but will change with test frequency. Leakage of the reference mixer IF to the test mixer IF path has similar characteristics, but its value doesn't change with frequency.
2 RF signal from the reflection test receiver (b1) that leaks to the transmission test receiver. This signal depends upon the input reflection of the DUT; if the DUT is well matched, there will be no signal at the reflection receiver. Since this signal depends upon the DUT, correcting for it is more complicated.
3 RF signal that leaks from the test set switch, to port 2, and reflects off the DUT output match into the port 2 transmission test mixer. As this signal depends upon the DUT characteristics, correcting for it can also be more complicated. Modern VNAs that use separate sources instead of test set switches eliminate this source of crosstalk.
4 The final source of signal leakage is related to any test fixture or probing done to connect to the DUT. Leakage from port 1 to port 2 of the probes or fixtures is usually electric field radiation or magnetic field coupling between the ports. Since these fields are non‐TEM, they do not remain constant with changes in the DUT characteristics, and their effect may not be well understood. Probe‐to‐probe isolation is a key problem in measurements, but one that is not well accounted for. Careful fixture or probe design that includes shielding is perhaps the best solution to this final leakage effect.
In most modern VNAs, the design of the mixers and LO isolation networks are such that the level of the first three sources of crosstalk are at or below the noise floor of the receiver. As such they can be ignored except in special cases where extended dynamic range is desired, as discussed in Chapter 6. The fourth cause of crosstalk is inherent in the fixtures or probes, and it can sometimes be removed with calibration. But since the source is often due to radiation from one port to the other, this radiation pattern depends in a complex way on the actual loading of the port and the structure of the DUT. For example, in a probed situation, leaving the probes up as an “open” calibration standard can cause the probes to act as E‐field antennas and can produce crosstalk between the probes. Grounding the probes, to produce a short, can cause magnetic field coupling between the probes, again producing crosstalk. Both of these crosstalk terms are non‐TEM, meaning they have E and H fields that propagate in the direction from port 1 to port 2. Normal calibration methodologies do not correct for non‐TEM crosstalk as their values do not remain constant if the DUT configuration changes.
2.2.6 IF and Data Processing
The final hardware portion of the VNA block diagram is the IF processing chain. The VNA receiver converts the RF signal to a first IF frequency, which is further converted and detected in the IF processing path. In older analyzers, such as the HP‐8510, this consisted of a synchronous analog second‐converter that produced two DC outputs proportional the real and imaginary portions of the RF voltage at the receiver input. These DC voltages were measured with DC analog‐to‐digital converters (ADCs) that produced a digital representation of the real and imaginary values. More modern IF structures such as in the HP‐8753 or HP‐8720 used a second stage of IF down‐conversion to bring the IF signal down to a frequency where an AC ADC could directly sample the waveform. The final IF frequency was set by the sampling rate of the ADC.
2.2.6.1 ADC Design
Интервал:
Закладка:
Похожие книги на «Handbook of Microwave Component Measurements»
Представляем Вашему вниманию похожие книги на «Handbook of Microwave Component Measurements» списком для выбора. Мы отобрали схожую по названию и смыслу литературу в надежде предоставить читателям больше вариантов отыскать новые, интересные, ещё непрочитанные произведения.


Обсуждение, отзывы о книге «Handbook of Microwave Component Measurements» и просто собственные мнения читателей. Оставьте ваши комментарии, напишите, что Вы думаете о произведении, его смысле или главных героях. Укажите что конкретно понравилось, а что нет, и почему Вы так считаете.