Joel P. Dunsmore - Handbook of Microwave Component Measurements
Здесь есть возможность читать онлайн «Joel P. Dunsmore - Handbook of Microwave Component Measurements» — ознакомительный отрывок электронной книги совершенно бесплатно, а после прочтения отрывка купить полную версию. В некоторых случаях можно слушать аудио, скачать через торрент в формате fb2 и присутствует краткое содержание. Жанр: unrecognised, на английском языке. Описание произведения, (предисловие) а так же отзывы посетителей доступны на портале библиотеки ЛибКат.

- Название:Handbook of Microwave Component Measurements
- Автор:
- Жанр:
- Год:неизвестен
- ISBN:нет данных
- Рейтинг книги:5 / 5. Голосов: 1
-
Избранное:Добавить в избранное
- Отзывы:
-
Ваша оценка:
Handbook of Microwave Component Measurements: краткое содержание, описание и аннотация
Предлагаем к чтению аннотацию, описание, краткое содержание или предисловие (зависит от того, что написал сам автор книги «Handbook of Microwave Component Measurements»). Если вы не нашли необходимую информацию о книге — напишите в комментариях, мы постараемся отыскать её.
Handbook of Microwave Component Measurements — читать онлайн ознакомительный отрывок
Ниже представлен текст книги, разбитый по страницам. Система сохранения места последней прочитанной страницы, позволяет с удобством читать онлайн бесплатно книгу «Handbook of Microwave Component Measurements», без необходимости каждый раз заново искать на чём Вы остановились. Поставьте закладку, и сможете в любой момент перейти на страницу, на которой закончили чтение.
Интервал:
Закладка:
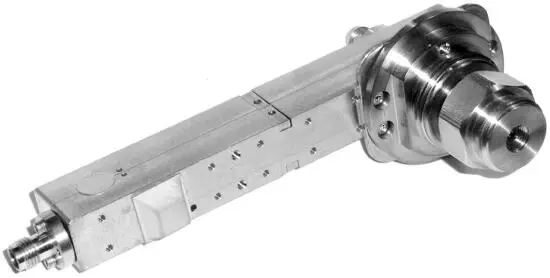
Figure 2.18 A directional coupler used in VNAs.
2.2.4.3 1+Gamma
Another proposed reflectometer structure is a 1+gamma structure, whose name comes from the block‐diagram architecture, shown in Figure 2.19. As the name implies, the signal at the b1 receiver is a combination of the incident ( a1 ) and reflected (gamma) signal.
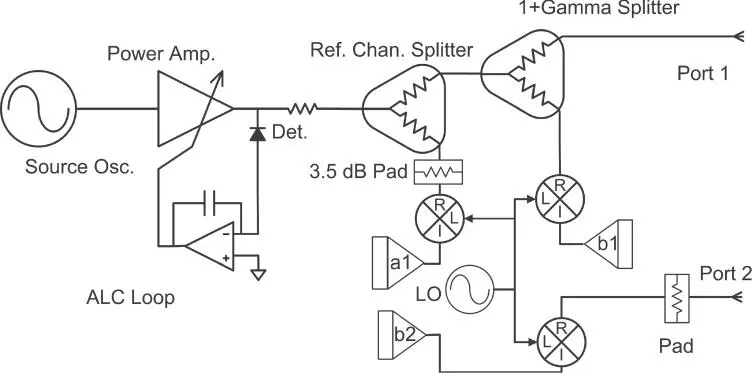
Figure 2.19 Block diagram of a 1+gamma reflectometer.
In this configuration, the signal in the test or b1 receiver never goes to zero; rather, it is minimum with a short, maximum with an open, and nominal 1 when there is a load attached. Also, the signal variation between an open and short is about 14 dB less than that for a bridge or directional‐coupler. Put another way, the reflection gain of the 1+gamma bridge is lower than for a directional‐coupler or bridge. Consider the Smith chart in Figure 2.20; an open, short, and load (all non‐ideal with fringing capacitance and series inductance) are shown for each on a 1+gamma reflectometer.
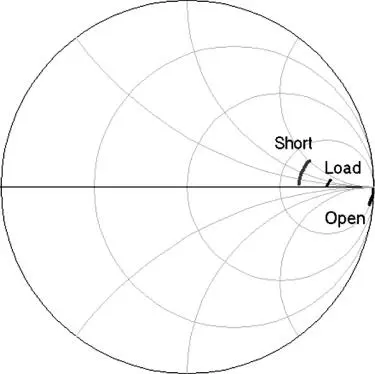
Figure 2.20 Smith chart showing reflections of a 1+gamma bridge with an open, short, and load.
The value of attenuation in the reference channel is adjusted to set the value of the open circuit reflection to 1. For a directional‐coupler, the load gives a zero reflection (ideally), and the short gives a −1 reflection. For the 1+gamma bridge, the open is also 1, but the short is +0.6, and the load is +0.75; thus, the difference between the open and the short moves from 2 to only 0.4. These reflections are mapped to the full Smith chart through the error correction math, in such a way that the values from the reflections, and any instability, are multiplied by 5. Also, since the load condition has a large signal in the b1 receiver, any instability in that signal is apparent as a directivity error, which is also multiplied by 5. In theory, if directivity is defined as the average of the open/short response relative to the load response, then the directivity of a 1+gamma reflectometer is about 0 dB (remember that directivity for a coupler or bridge is always positive, often 20 dB or more).
Theoretically, any directivity error can be corrected for by a calibration, but in practice, certain unstable errors can cause uncorrectable errors when the directivity is poor. Thus, 1+gamma structures have largely disappeared from use. Also, this same multiplying effect causes any slight drift in the test port cable to cause a considerable change in the measured reflection coefficient, after calibration.
2.2.5 VNA Receivers
The final RF components in a VNA block diagram are the test and reference receivers. Dynamic range is a key specification of a VNA and is sometimes referred to as the difference between the maximum signal level that the receiver can accept while still operating and the noise floor of the receiver. In most cases, the maximum damage level is significantly above the maximum operating level of the receiver, which is usually limited by the input compression level of the receiver. The maximum operating level is set by the structure of the components, but for most modern VNAs, it is around the −5 dBm at the receiver mixer input, or about +10 dBm at the test port, after considering the coupling factor of the test port coupler. The noise floor of the receiver is set primarily by the type of mixing down‐converter used, of which the two principal types are sampling down‐converters (or samplers) and mixers.
2.2.5.1 Samplers
The sampling down‐converters are circuits that are driven by a low frequency pulse, which has very high harmonic content. The example circuit shown in Figure 2.21is typical of older VNA sampling receivers such as found in the HP8753 or HP8510 VNAs. In the circuit, the diode pair acts like a switch, which is driven with a very short pulse from a pulse generator driven by a voltage‐controlled oscillator (VCO), operating at relatively low frequencies. The short conduction angle (the amount of a cycle that the diodes conduct) of the pulse means that the frequency content is very high, sometimes referred to as a harmonic‐comb , and the sampler can convert frequencies much higher than the VCO drive.
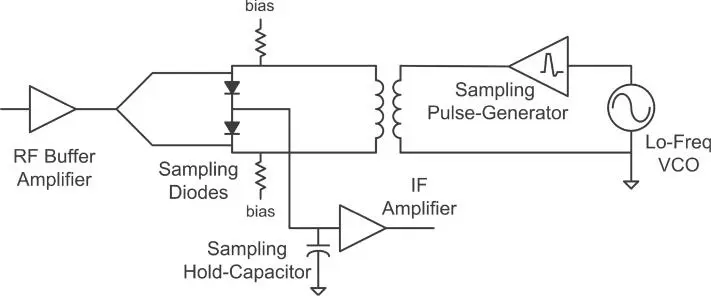
Figure 2.21 Schematic of a sampler.
It is not unusual to use harmonics of up to 200 times the VCO frequency. Because the conduction angle is so short, the effective input impedance is high, essentially multiplied by the maximum harmonic number, and this means the effective noise figure of the sampler is high as well. Since the conduction angle does not depend upon the frequency being measured, the noise figure does not depend upon the frequency being measured. The conduction angle and conversion efficiency can be adjusted by adjusting the diode bias so that they are not quite turned on, and the pulse provided by the VCO gives the extra current to turn on the diodes fully.
Some advantages of samplers are that they do not require a high frequency local oscillator, as a mixer would, and they can simultaneously down‐convert a signal and all its harmonics to the intermediate frequency (IF). This capability is exploited in a sampling oscilloscope, and now in some of the modern versions of sampling VNAs used for non‐linear measurements. However, for the most part samplers have been largely abandoned in VNAs due to a number of difficult problems that they present.
The foremost problem is the degraded noise floor in the sampler‐based VNA. The effective noise floor is further reduced as the conversion efficiency of higher‐order harmonics typically degrades near the top of the sampler frequency range. Almost all modern VNAs use some form of mathematical response correction on the sampler response so that frequency response of the VNA receiver to a constant input power appears flat over its entire frequency range. This response correction, which removes the effect of roll‐off in real conversion loss, has the consequence of increasing the apparent noise floor of the sampler at higher frequencies.
A secondary problem with samplers is that the rich harmonic‐content of the VCO dictates that the sampling receiver has many regions where it is sensitive to other signals, such as harmonics or spurious signals of the VNA source or DUT, and spurious signals present at the DUT output. This makes sampling receivers particularly poor at measuring mixers or frequency converters, where the sampling comb‐tooth can cross mixer output signals at many different frequencies. Figure 2.22shows an example of spurs from a source generating responses in a sampling receiver. In this case, the source signal is generated by mixing a 3.8 GHz fixed RF signal with a 3.8–6.8 GHz swept yttrium‐iron‐garnet (YIG) oscillator LO. The mixed product provides the desired 0–3 GHz source output, but spurious signals at 2 · RF − LO and 3 · RF − 2 · LO do show up in the 0–3 GHz VNA measurement receiver band. While small, these spurious responses do degrade the S21 accuracy.
Читать дальшеИнтервал:
Закладка:
Похожие книги на «Handbook of Microwave Component Measurements»
Представляем Вашему вниманию похожие книги на «Handbook of Microwave Component Measurements» списком для выбора. Мы отобрали схожую по названию и смыслу литературу в надежде предоставить читателям больше вариантов отыскать новые, интересные, ещё непрочитанные произведения.


Обсуждение, отзывы о книге «Handbook of Microwave Component Measurements» и просто собственные мнения читателей. Оставьте ваши комментарии, напишите, что Вы думаете о произведении, его смысле или главных героях. Укажите что конкретно понравилось, а что нет, и почему Вы так считаете.