Joel P. Dunsmore - Handbook of Microwave Component Measurements
Здесь есть возможность читать онлайн «Joel P. Dunsmore - Handbook of Microwave Component Measurements» — ознакомительный отрывок электронной книги совершенно бесплатно, а после прочтения отрывка купить полную версию. В некоторых случаях можно слушать аудио, скачать через торрент в формате fb2 и присутствует краткое содержание. Жанр: unrecognised, на английском языке. Описание произведения, (предисловие) а так же отзывы посетителей доступны на портале библиотеки ЛибКат.

- Название:Handbook of Microwave Component Measurements
- Автор:
- Жанр:
- Год:неизвестен
- ISBN:нет данных
- Рейтинг книги:5 / 5. Голосов: 1
-
Избранное:Добавить в избранное
- Отзывы:
-
Ваша оценка:
Handbook of Microwave Component Measurements: краткое содержание, описание и аннотация
Предлагаем к чтению аннотацию, описание, краткое содержание или предисловие (зависит от того, что написал сам автор книги «Handbook of Microwave Component Measurements»). Если вы не нашли необходимую информацию о книге — напишите в комментариях, мы постараемся отыскать её.
Handbook of Microwave Component Measurements — читать онлайн ознакомительный отрывок
Ниже представлен текст книги, разбитый по страницам. Система сохранения места последней прочитанной страницы, позволяет с удобством читать онлайн бесплатно книгу «Handbook of Microwave Component Measurements», без необходимости каждый раз заново искать на чём Вы остановились. Поставьте закладку, и сможете в любой момент перейти на страницу, на которой закончили чтение.
Интервал:
Закладка:
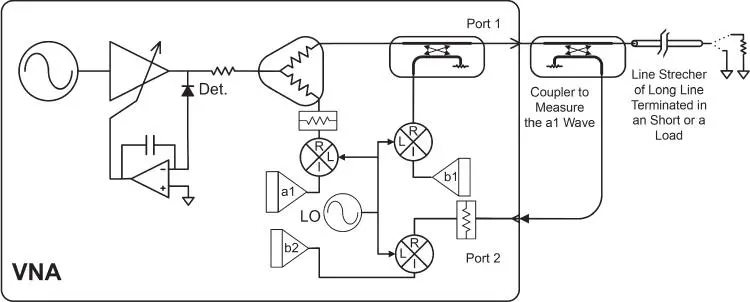
Figure 2.8 Block diagram for measuring power source‐match.
A line‐stretcher is a transmission line structure, usually stripline, that allows the length of the transmission line to be varied. These are sometimes called trombone‐lines because the center conductor is constructed as a trombone‐like slider. An example of one is shown in Figure 2.9.
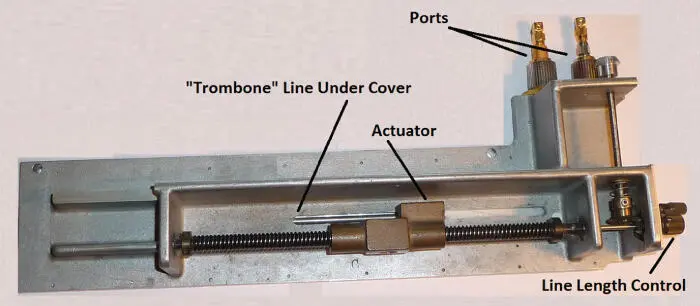
Figure 2.9 A line stretcher used for match measurements.
The traces shown in Figure 2.10measure the a1 wave from the test port output by adding an external coupler and routing the coupled arm to the b2 receiver. The main arm of the coupler is connected to a power meter, and the power is set to obtain −10 dBm; then the b2 receiver is calibrated to this output power. Next the power meter is removed, and a long line terminated in full reflection (short or open) is put in its place. The ripple on the trace is an indication of the power mismatch. Though not shown, in this case the effective source‐match (or ratio source‐match) is good, but the output power has ripple related to the power mismatch. When the line is terminated with a short or open, the peak‐to‐peak ripple is exactly the voltage standing‐wave‐ratio (VSWR) of the power source‐match. The upper trace is a measurement of a system with a power splitter used for the reference signal separator; the lower trace shows the same measurement, but this time the power splitter is replaced with a directional‐coupler for the reference‐channel signal separation. Clearly, there is an improvement in the power source‐match using the coupler.
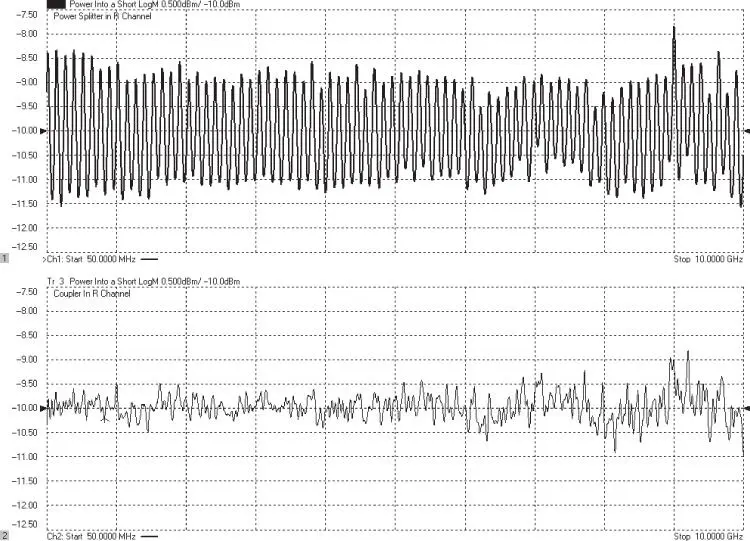
Figure 2.10 Measurement of long line indicating power source‐match using an external coupler terminated in a short: a two‐resistor power splitter (upper) and a trace for a coupler in the reference path (lower).
At any frequency, the VSWR of the power source‐match can be determined from this response; the envelope of the response can be used directly, or the line stretcher may be adjusted to obtain a peak and valley at any frequency of interest, from which the power source‐match is computed as
(2.2) 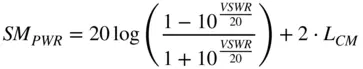
where VSWR is the peak‐to‐peak ripple in dB found at the output of the monitoring coupler and L CMis the loss in the main arm of the monitoring coupler. In the upper trace of the previous example, the p‐p ripple at low frequency is about 3.0 dB, and the mainline loss of the external coupler is about 1.6 dB, so the power source‐match is
(2.3) 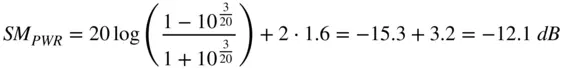
This is almost exactly the power match expected from a 50 Ω splitter (83.3 Ω or −12.05 dB). The lower trace shows a power source‐match for a directional‐coupler of around −21.6 dB at low frequencies, and −18 dB at higher frequencies.
Extracting the effective match from a mismatch ripple is a technique that will be useful for many other analyses in component measurement. An alternative test method uses a mismatch pad connected to another of the VNA ports, and the ripple is measured at the second port. In such a case, the VSWR is computed into the value of the mismatch, and the return loss value of the mismatch pad is subtracted to the measured VSWR of the source to find the true value. The ripple here is different from the reference channel ripple of the measured wave at the a1 receiver shown in Figure 2.7, as the effects of mismatch after the reference splitter are not apparent at the a1 receiver.
The power source‐match is normally set by the ALC loop in the source, and as such the reflections from the DUT are sensed by the detector diode in the ALC loop such that the source power is adjusted to maintain a constant voltage at the detector.
2.2.2.3 Source Output Impedance
The effective output match of the VNA source is the same as the power source‐match over the region within the ALC loop bandwidth of the source signal. In that region, the ALC loop responds to reflection signals as described earlier. Outside the ALC loop, the source presents a different output impedance. This is the reflection that would be measured in response to a signal not related to the source output signal. This source reflection is important in cases where the DUT presents other signals reflected into the source, such as from a mixer, or intermodulation products from the input of an amplifier. This value represents the manner in which these other signals would be reflected back out of the source. It can be measured directly as any other reflection coefficient, using a separate VNA reflectometer; an example measurement is shown in Figure 2.11, where the internal source is set to 1 GHz. Here, the internal VNA source frequency is shown as a large spike at 1 GHz on the source output‐impedance measurement. This is again a case where the coupler in the R‐channel used to sample the incident wave provides better match (lower trace) than a two‐resistor splitter (upper trace), at least at low frequencies where mismatch after the reference splitter is minimal.
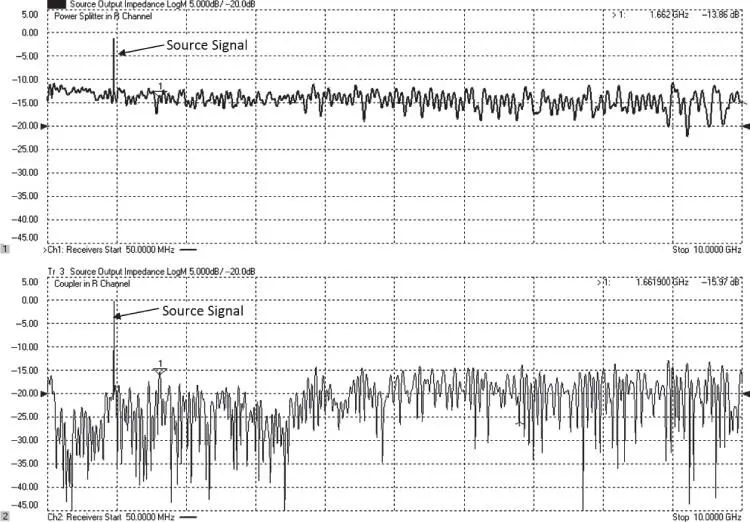
Figure 2.11 Measured source output impedance away from the source frequency: a trace using a power splitter in the R channel (upper) and a trace using a coupler (lower).
2.2.3 VNA Test Set
2.2.3.1 Test Set Switch
In some VNAs the source is switched between ports using a test set switch, which can come before or after the reference channel splitter. The termination of this switch provides the load match of the port when the source is not active on that port. This load match is not the same as the source‐match (ratio or power) and so some advanced calibration techniques that rely on the port match being consistent whether the port is a source or a load must be modified, as discussed in the next chapter. If the switch comes before the reference channel splitter, there will be a reference channel receiver for each port (four‐receiver VNA, Figure 2.2lower). If the switch comes after the reference channel splitter (three‐receiver VNA, Figure 2.2upper), the reference channel is shared between ports. It samples the source signal only when the source is active. This three‐receiver architecture does not support some calibration methods, such as thru‐reflect‐line (TRL) and so modifications and compromises to the calibration methods must be made.
The short explanation for the difficulty is that TRL calibration methods require measuring the load match of port 2, when port 1 is active. To do this measurement, the ratio of a2 / b2 is acquired during the thru step. But there is no a2 receiver available in the three‐receiver architecture. Modifications can be made that assume the source‐match and load match of the port are identical, but this case is not common unless attenuation is added after the reference channel split. Attenuation added reduces the difference between source and load match at a port by twice the attenuation value. Pre‐characterization of the difference in source and load match, called the delta‐match , can be performed and removes the need for characterization at the time of calibration. This allows three‐receiver architectures to support the same calibration as four‐receiver architectures and is found in some of the more modern low‐cost analyzers.
Читать дальшеИнтервал:
Закладка:
Похожие книги на «Handbook of Microwave Component Measurements»
Представляем Вашему вниманию похожие книги на «Handbook of Microwave Component Measurements» списком для выбора. Мы отобрали схожую по названию и смыслу литературу в надежде предоставить читателям больше вариантов отыскать новые, интересные, ещё непрочитанные произведения.


Обсуждение, отзывы о книге «Handbook of Microwave Component Measurements» и просто собственные мнения читателей. Оставьте ваши комментарии, напишите, что Вы думаете о произведении, его смысле или главных героях. Укажите что конкретно понравилось, а что нет, и почему Вы так считаете.