Joel P. Dunsmore - Handbook of Microwave Component Measurements
Здесь есть возможность читать онлайн «Joel P. Dunsmore - Handbook of Microwave Component Measurements» — ознакомительный отрывок электронной книги совершенно бесплатно, а после прочтения отрывка купить полную версию. В некоторых случаях можно слушать аудио, скачать через торрент в формате fb2 и присутствует краткое содержание. Жанр: unrecognised, на английском языке. Описание произведения, (предисловие) а так же отзывы посетителей доступны на портале библиотеки ЛибКат.
- Название:Handbook of Microwave Component Measurements
- Автор:
- Жанр:
- Год:неизвестен
- ISBN:нет данных
- Рейтинг книги:5 / 5. Голосов: 1
-
Избранное:Добавить в избранное
- Отзывы:
-
Ваша оценка:
- 100
- 1
- 2
- 3
- 4
- 5
Handbook of Microwave Component Measurements: краткое содержание, описание и аннотация
Предлагаем к чтению аннотацию, описание, краткое содержание или предисловие (зависит от того, что написал сам автор книги «Handbook of Microwave Component Measurements»). Если вы не нашли необходимую информацию о книге — напишите в комментариях, мы постараемся отыскать её.
Handbook of Microwave Component Measurements — читать онлайн ознакомительный отрывок
Ниже представлен текст книги, разбитый по страницам. Система сохранения места последней прочитанной страницы, позволяет с удобством читать онлайн бесплатно книгу «Handbook of Microwave Component Measurements», без необходимости каждый раз заново искать на чём Вы остановились. Поставьте закладку, и сможете в любой момент перейти на страницу, на которой закончили чтение.
Интервал:
Закладка:
In some special applications, such as using measurements of a transmission line loaded with some material to determine the properties of the material, none of the elements of the telegraphers' equation can be ignored.
At higher frequencies, the loss of a cable is increased due to skin effect, which can be shown to increase as the square root of frequency (Collin 1966).
(1.78) 
Thus, the insertion loss of an airline coaxial cable depends only upon the resistance per unit length of the cable, and so the insertion loss (in dB) per unit length, as a function of frequency, can be directly computed as
(1.79) 
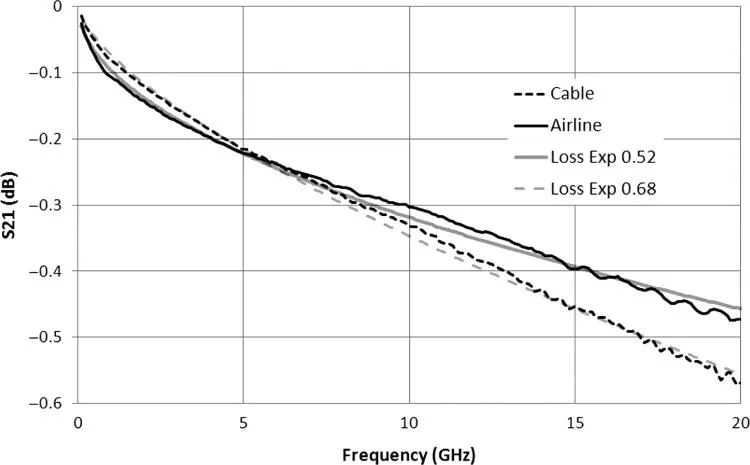
where R aand R bare the inner and outer conductor radius and r contains the square root of frequency. Thus, all the attributes can be lumped into a simple single loss‐term, A. Figure 1.14shows the loss of a 10 cm airline as well as the idealized loss, as described in Eq. (1.79), where good agreement to theory is seen. However, the introduction of dielectric loading of the coaxial line will add some additional loss due to the loss tangent of the dielectric. This additional loss often presents itself as an equivalent conductance per unit length, and this loss is often more significant that the skin‐effect loss. Because of dielectric loss, the computed loss of (1.79)fails to fit many cables. The equation can be generalized to account for differing losses by modifying the exponent to obtain
(1.80) 
where the loss is expressed in dB, and A and b are the loss factor and loss exponent. From the measured loss at two frequencies, it is possible to find the loss factor and loss exponent directly, although better results can be obtained by using a least‐squares fit to many frequency points. Figure 1.14shows the loss of a 15 cm section of 0.141 in. semi‐rigid coaxial cable. The values for the loss at one‐fourth and three‐fourths of the frequency span are recorded. From these two losses, the loss factor and exponent are computed as


Figure 1.14 Loss of a 15 cm airline and a 15 cm semi‐rigid Teflon‐loaded coaxial line.
Taking the log of both sides, this can be turned in to a linear system as
(1.81) 
This system of linear equations can be solved for the loss factor A and the loss exponent b .


The computed loss for all frequencies from Eq. (1.80)is also shown, with remarkably good agreement to the measured values over a wide range. Ripples in the measured response are likely due to small calibration errors, as discussed in Chapter 5.
The insertion phase of a cable can likewise be computed; in practice, a linear approximation is typically sufficient, but the phase of a cable will vary with frequency beyond the linear slope due to loss as well.
The velocity of propagation for a lossless transmission line is
(1.84) 
The impedance of a lossy cable must be complex from Eq. (1.77), and thus the phase response must deviate from a pure linear phase response, due to the phase velocity changing with frequency at lower frequencies. A special case for airlines, which have no dielectric loss, is
(1.85) 
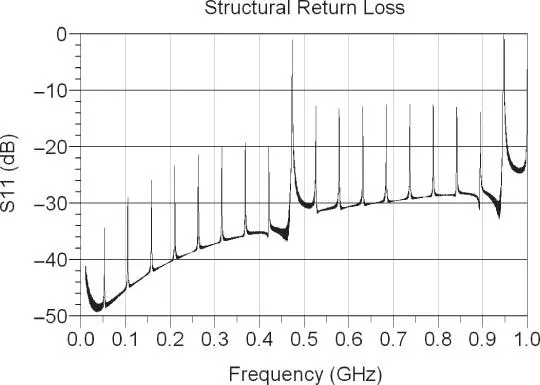
For cables in general, the dielectric loss will cause a deviation in the velocity of propagation similar to that seen for loss. So far the discussion has focused on ideal low‐loss cables, but in practice cables have defects that cause the impedance of the cable to vary along the cable. If these defects are occasional, they cause little concern and are typically overlooked unless they are so large as to cause a noticeable discrete reflection (more of that in Chapter 5). However, during cable manufacturing it is typical that the processing equipment contains elements such as spooling machines or other circular equipment (e.g. pulleys, spindles). If these have any defects in the circularity, or even a discrete flaw like a dimple, it can cause minute but periodic changes in the impedance of the cable. A flaw that causes even a one‐tenth Ω deviation of impedance periodically over a long cable can cause substantial system problems called structural return loss (SRL), as shown in Figure 1.15. These periodic defects add up all at one frequency and can cause very narrow (as low as 100 kHz BW) very high return loss peaks, and thereby cause insertion loss dropouts at these same frequencies. In practice, the SRL test is the most difficult for low‐loss, long‐length cables such as those used in the CATV industry. Figure 1.16shows a simulation of a SRL response caused by a 15 mm long, 0.1 Ω impedance variation, every 30 cm, and another −0.1 Ω variation every 2.7 m, each on the same 300 m coaxial cable with an insertion loss typical for main‐line CATV cables. In the figure, two SRL effects are shown; a smaller effect every 50 MHz or so, due to the 2.7 m periodic variation, and a much higher effect every 500 MHz or so due to the 30 cm impedance variation. The higher impedance variation occurs more often, and so the periodic error will have a greater cumulative effect resulting in a nearly full reflection, as shown in the figure.

Figure 1.15 A model of a coax line with periodic impedance disturbances.

Figure 1.16 The return loss of a line with structural return loss.
1.8.2 Connectors
Connectors provide the means to transition from one transmission media to another. They are often not considered as part of the device or measurement system, but their effects can dominate the results of a measurement, particularly for low‐loss devices. Connectors can be distinguished by the quality and application. One remarkable aspect of connectors is the great difficulty in measuring them with any kind of accuracy. This is because most connectors provide a transition between different media, such as from a coaxial cable to a connector interface or from a PC board to a connector interface. While the connector interface is often well defined, the “back‐end” of the connector is poorly defined.
Читать дальшеИнтервал:
Закладка:
Похожие книги на «Handbook of Microwave Component Measurements»
Представляем Вашему вниманию похожие книги на «Handbook of Microwave Component Measurements» списком для выбора. Мы отобрали схожую по названию и смыслу литературу в надежде предоставить читателям больше вариантов отыскать новые, интересные, ещё непрочитанные произведения.
Обсуждение, отзывы о книге «Handbook of Microwave Component Measurements» и просто собственные мнения читателей. Оставьте ваши комментарии, напишите, что Вы думаете о произведении, его смысле или главных героях. Укажите что конкретно понравилось, а что нет, и почему Вы так считаете.


