Joel P. Dunsmore - Handbook of Microwave Component Measurements
Здесь есть возможность читать онлайн «Joel P. Dunsmore - Handbook of Microwave Component Measurements» — ознакомительный отрывок электронной книги совершенно бесплатно, а после прочтения отрывка купить полную версию. В некоторых случаях можно слушать аудио, скачать через торрент в формате fb2 и присутствует краткое содержание. Жанр: unrecognised, на английском языке. Описание произведения, (предисловие) а так же отзывы посетителей доступны на портале библиотеки ЛибКат.

- Название:Handbook of Microwave Component Measurements
- Автор:
- Жанр:
- Год:неизвестен
- ISBN:нет данных
- Рейтинг книги:5 / 5. Голосов: 1
-
Избранное:Добавить в избранное
- Отзывы:
-
Ваша оценка:
Handbook of Microwave Component Measurements: краткое содержание, описание и аннотация
Предлагаем к чтению аннотацию, описание, краткое содержание или предисловие (зависит от того, что написал сам автор книги «Handbook of Microwave Component Measurements»). Если вы не нашли необходимую информацию о книге — напишите в комментариях, мы постараемся отыскать её.
Handbook of Microwave Component Measurements — читать онлайн ознакомительный отрывок
Ниже представлен текст книги, разбитый по страницам. Система сохранения места последней прочитанной страницы, позволяет с удобством читать онлайн бесплатно книгу «Handbook of Microwave Component Measurements», без необходимости каждый раз заново искать на чём Вы остановились. Поставьте закладку, и сможете в любой момент перейти на страницу, на которой закончили чтение.
Интервал:
Закладка:
where N Fminis the minimum noise figure; Γ Opt, called gamma‐opt , is the reflection coefficient (magnitude and phase) that gives the minimum noise figure; and R N, sometimes called the noise resistance , describes how the noise figure increases as the source impedances varies from the gamma‐opt. The characterization required to determine these values is quite complex and is covered in Chapter 6.
1.6 Distortion Parameters
Up to now, all the parameters described have been under the consideration that the DUT is linear. However, when a DUT, particularly an amplifier, is driven with a large signal, non‐linear transfer characteristics become significant, leading to an entirely new set of parameters used to describe these non‐linear characteristics.
1.6.1 Harmonics
One of the first noticeable effects of large signal drive is the generation of harmonics at multiples of the input frequency. Harmonics are described by their order and either by their output power or, more commonly, by the power relative to the output power of the fundamental, and almost always in dBc (dB relative to the carrier). Second harmonic is short for second‐order harmonic and refers to the harmonic found at two times the fundamental, even though it is in fact the first of the harmonic frequency above the fundamental; third harmonic is found at three times the fundamental, and so on. Surprisingly, there are not well‐established symbols for harmonics; for this book, we will use H2, H3 … Hn to represent the dBc values of harmonics or order 2, 3 … respectively. In Chapter 6, the measurements of harmonics are fully developed as part of the description of X‐parameters and utilize the notation b 2, mto describe the output normalized wave power at port 2 for the m th harmonic. A similar notation is used for harmonics incident on the amplifier.
One important attribute of harmonics is that for most devices the level of the harmonics increases in dB value as the power of the input increases and to a rate directly proportional to the harmonic order, as shown in Figure 1.6. In this figure, the x‐axis is the drive power, and the y‐axis is the measured output power of the fundamental and the harmonics.
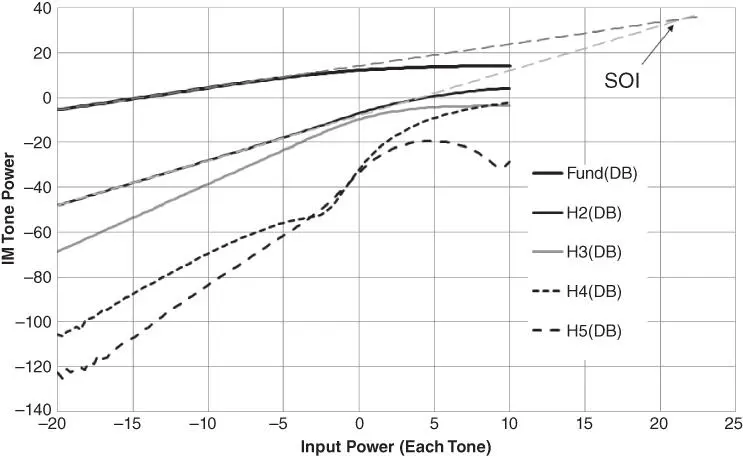
Figure 1.6 Output power of harmonics of an amplifier.
1.6.2 Second‐Order Intercept
This pattern of increasing power as the input power is increased, but to the slope related to the order of the harmonic, cannot continue indefinitely or the harmonic power would exceed the fundamental power. While theoretically possible, in practice the harmonic power saturates just as the output power does and never crosses the level of the output power. However, if one uses the lower power regions to project a line from the fundamental and each of the harmonics, they will intersect at some power, as shown in Figure 1.6. The level that these lines converge is called the intercept point , and the most common value is the second‐order intercept (SOI), and intercept points beyond third order are seldom used.
There is sometimes confusion in the use of the term SOI; while it is most commonly used to refer to the second harmonic content, in some case, it has also been used to refer to the two‐tone SOI, which is a distortion product that occurs at the sum of the two tones. Most properly, one should always use the term two‐tone SOI if one is to distinguish from the more common harmonic SOI.
1.6.3 Two‐Tone Intermodulation Distortion
While the harmonic measurement provides a direct characterization of distortion, it suffers from the fact that the harmonic frequencies are far away from the fundamental, and in many circuits, the network response is such that the harmonic content is essentially filtered out. Thus, it is not possible to discern the non‐linear response of such a network by measuring only the output signal. Of course, if the gain is measured, compression of the amplifier will show that the value of S21 changes with the input drive level. But it is convenient to have a measure or figure of merit of the distortion of an amplifier that relies only on the output signal. In such a case, two signals of different frequencies can be applied at the amplifier input, at a level sufficiently large to cause a detectible non‐linear response of the amplifier. Figure 1.7shows a measurement of a two‐tone signal applied to the input of an amplifier (lower trace) and measured on the output of the amplifier (upper trace).
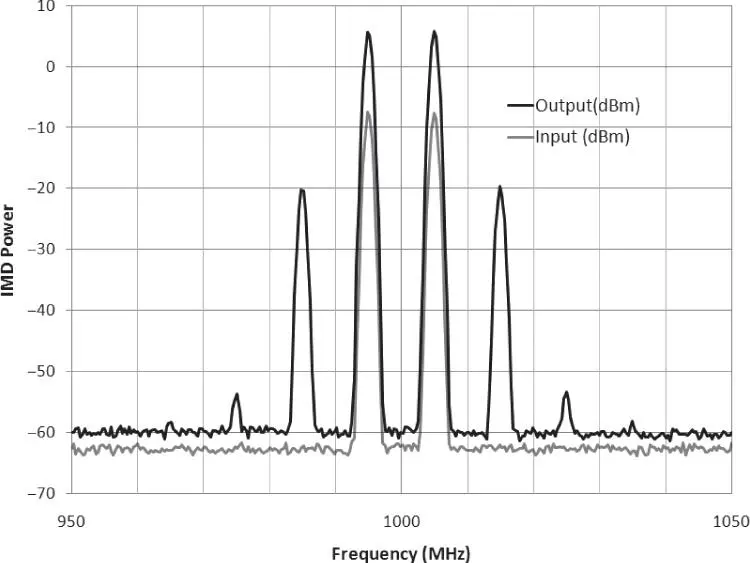
Figure 1.7 Measurement of a two‐tone signal at the input and output of an amplifier.
It is clear that several other tones are present at the output and are the result of higher‐order products mixing in the amplifier due to its non‐linear response and creating other signals. The principal signals of interest are the higher and lower intermodulation (IM) products, PwrN_Hi and PwrN_Lo, where N is the order of intermodulation distortion (IMD). Normally, IM products refer to the power of the IM product relative to the carrier, in dBc, and these terms are called IMN_Hi and IMN_Lo. For example, the power in the lower third‐order tone is Pwr3_Lo; the level of the upper third‐order tone relative to the carrier is called IM3_Hi. The frequencies of the higher and lower tones are found at
(1.71) 
And more generally
(1.72) 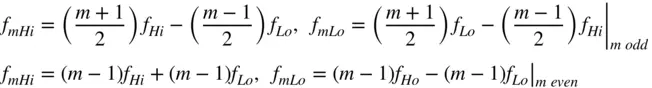
In Figure 1.7, the amplifier is driven such that the fifth‐order IM product is just visible above the noise floor in the upper trace.
IM products have the same attribute as harmonics with respect to drive power, and the power in the IM product (sometimes called the tone power , or PWR m for the m th‐order IM power) increases in direct proportion to the input power and the order of the IM product. Thus, if the tone power is plotted along with the output power against an x‐axis of input power, the plot will look like Figure 1.8, where the extension of the slope of the output power and IM tone‐powers at low drives will intersect. This point of intersection for the third‐order IM product is known as the third‐order intercept point, or IP3. Similarly, IP5 is the fifth‐order intercept point, etc.
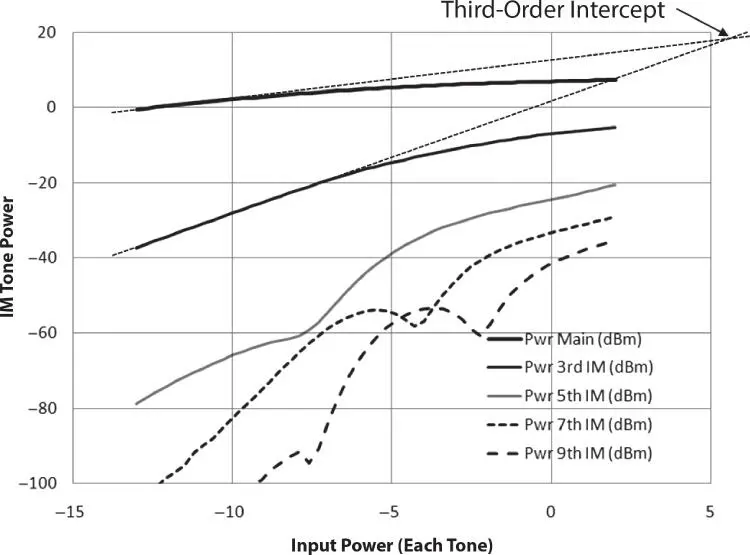
Figure 1.8 Output power and IM tone‐power versus input power.
It is also interesting to note that in general at high powers, the IM tone‐powers may not increase but may decrease or have local minima. This is because of the effect of high‐order IM products re‐mixing and creating significant signals that lie on the lower‐order products and can increase or decrease their level, depending upon the phasing of the signals.
There is often some confusion about third‐order IM products (IM3) and third‐order intercept point (IP3), and both are sometimes referred to as third‐order intermod . For clarity, in this book, the intercept point will always be referred to as IP.
Читать дальшеИнтервал:
Закладка:
Похожие книги на «Handbook of Microwave Component Measurements»
Представляем Вашему вниманию похожие книги на «Handbook of Microwave Component Measurements» списком для выбора. Мы отобрали схожую по названию и смыслу литературу в надежде предоставить читателям больше вариантов отыскать новые, интересные, ещё непрочитанные произведения.


Обсуждение, отзывы о книге «Handbook of Microwave Component Measurements» и просто собственные мнения читателей. Оставьте ваши комментарии, напишите, что Вы думаете о произведении, его смысле или главных героях. Укажите что конкретно понравилось, а что нет, и почему Вы так считаете.