Joel P. Dunsmore - Handbook of Microwave Component Measurements
Здесь есть возможность читать онлайн «Joel P. Dunsmore - Handbook of Microwave Component Measurements» — ознакомительный отрывок электронной книги совершенно бесплатно, а после прочтения отрывка купить полную версию. В некоторых случаях можно слушать аудио, скачать через торрент в формате fb2 и присутствует краткое содержание. Жанр: unrecognised, на английском языке. Описание произведения, (предисловие) а так же отзывы посетителей доступны на портале библиотеки ЛибКат.

- Название:Handbook of Microwave Component Measurements
- Автор:
- Жанр:
- Год:неизвестен
- ISBN:нет данных
- Рейтинг книги:5 / 5. Голосов: 1
-
Избранное:Добавить в избранное
- Отзывы:
-
Ваша оценка:
Handbook of Microwave Component Measurements: краткое содержание, описание и аннотация
Предлагаем к чтению аннотацию, описание, краткое содержание или предисловие (зависит от того, что написал сам автор книги «Handbook of Microwave Component Measurements»). Если вы не нашли необходимую информацию о книге — напишите в комментариях, мы постараемся отыскать её.
Handbook of Microwave Component Measurements — читать онлайн ознакомительный отрывок
Ниже представлен текст книги, разбитый по страницам. Система сохранения места последней прочитанной страницы, позволяет с удобством читать онлайн бесплатно книгу «Handbook of Microwave Component Measurements», без необходимости каждый раз заново искать на чём Вы остановились. Поставьте закладку, и сможете в любой момент перейти на страницу, на которой закончили чтение.
Интервал:
Закладка:
Finally, for amplifiers used as a low‐noise amplifier (LNA) at the input of a receiver chain, it is often desired to refer the IP level to the input power, which would produce an intercept point at the output. This is distinguished as the input intercept point (IIP), and in the case of ambiguity, the normal intercept point referencing to the output power should be most properly referred to as the output‐referred intercept point (OIP). The most common intercept points are the third‐order ones, OIP3 and IIP3. The input and output intercept points differ by the gain of the amplifier at drive level where the measurements are made.
The details of two‐tone IM measurements are discussed at length in Chapter 8.
1.6.4 Adjacent Channel Power and Adjacent Channel Level Ratio
One figure of distortion common with modulated signals is the adjacent channel power (ACP) and adjacent channel level ratio (ACLR). Sometimes a third term, adjacent channel power ratio (ACPR), is used instead of ACLR. All are measures of out‐of‐channel spectral regrowth caused principally by the third‐order intermodulation distortion occurring because of a modulated signal. During testing, a modulated signal waveform is applied to the DUT. Figure 1.9shows the output spectrum of a signal modulated with 16 quadrature amplitude modulation (16 QAM) over a 40 MHz BW, applied to an amplifier.
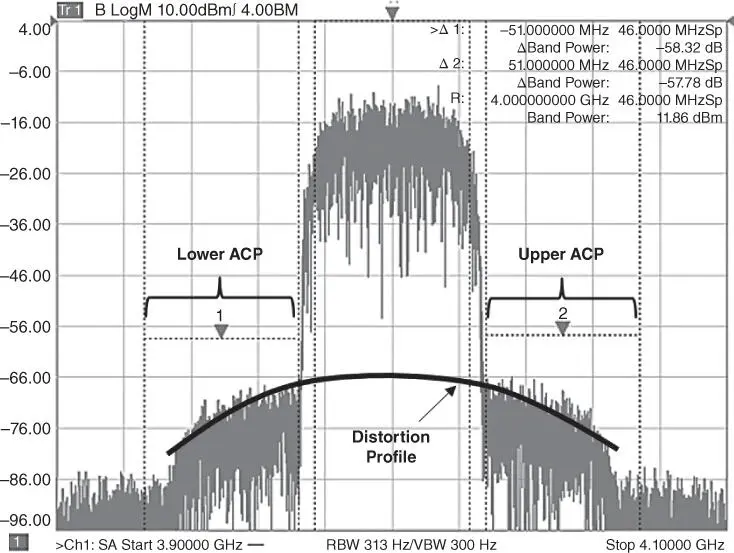
Figure 1.9 Spectral regrowth causing ACP in a 16 QAM signal.
It is a repetitive periodic waveform from an arbitrary waveform generator, which must be comprised of a multiple sinewave signals, typically thousands of tones, each of which can intermodulate with each other one. In a typical modulated signal, each tone can have a nearly random amplitude and phase, so it is quite complicated to measure each distortion product directly. In general, this figure of merit measures the intermodulation products, which appear in the adjacent channel to the channel under test, as a total integrated power using band power measurements.
In the figure, the lower and upper ACP region is identified, and the signal here is caused by the third‐order distortion in the amplifiers. Also identified is the outline of the distortion profile of the amplifier. ACP is used as a figure of merit as it is easy to discern the distortion level in the adjacent channel where there is no signal. However, the distortion occurs in‐channel as well as out‐of‐channel and is usually a bit higher in the center of the channel. The sloped response of the distortion profile is typical and can be understood by considering the density of signals that can create the intermodulation distortion. Note the outer edges of the adjacent channel where the distortion signal is lowest; only the outermost tones of the main signal can intermodulate to create a signal at these outer reaches of the adjacent channel. At the edge of the adjacent channel nearest the main signal, any two signals that are separated by one‐half the main‐signal bandwidth can intermodulate to create a signal here. The density of these signals is quite high, roughly half the power of the main signal. In the center of the main signal, where the distortion is not apparent because it is masked by the main‐signal power, it is outlined by the distortion profile curve in the figure; any two closely spaced signals can cause distortion power here. The density of such signals is over the whole bandwidth, so the distortion level here is roughly twice that at the close‐in edge of the ACP signal. Even though this distortion is masked by the main signal, it is still present and causes errors in the transmitted signal.
The total integrated power is the ACP. The ratio of the ACP to the total power in the main channel is the ACLR, shown by the Markers 1 and 2 in the figure (they are set to be a delta‐marker with respect to the reference Marker R, which shows the main tone absolute power). Often, test system noise can mask the ACP or ACLR to some extent and becomes the limitation of the measurement. Details of the ACP and ACLR measurements are found in Chapter 8.
1.6.5 Noise Power Ratio (NPR)
Widely found in the satellite communications industry, noise power ratio (NPR) is a measure of distortion, and not of noise at all. In the early days of satellite development, the industry needed a measure of distortion for satellite components but could not use the more common IMD or ACP. Most satellite systems have strongly channelized amplifiers, where the communication signals fill an entire channel and are filtered at the output so adjacent channel distortion would be filtered away, and could not be used as a figure of merit for the in‐channel distortion. Furthermore, the communications protocols for satellites could change over the life of the satellite, and often many different communication methods could be used in the same channel. NPR was developed to emulate a densely loaded communications channel but still provide a means to determine distortion.
In the early days, NPR signals were generated by using a noise diode followed by a filtered amplifier. This would produce a noise signal at high power, of the specified channel. This was followed by a narrow band‐stop filter, which blocked the noise signal in the middle of the channel. When this signal was applied to the system component, distortion of the amplifier could be seen in the notch of the NPR signal. Figure 1.10shows an example NPR signal, after passing through an amplifier. This is not one created by a noise diode, but rather using an arbitrary waveform generator, which is programmed to produce an additive‐white‐gaussian‐noise (AWGN) signal with a notch at its center. In fact, the use of noise diodes to produce NPR signals has been essentially replaced throughout the industry with arbitrary waveform‐generated signals. In this example, the AWGN signal is created in a low‐frequency baseband generator and then upconverted inside the signal source to the desired center frequency. Some unflatness is apparent in the passband of the signal due to frequency response of the signal source.
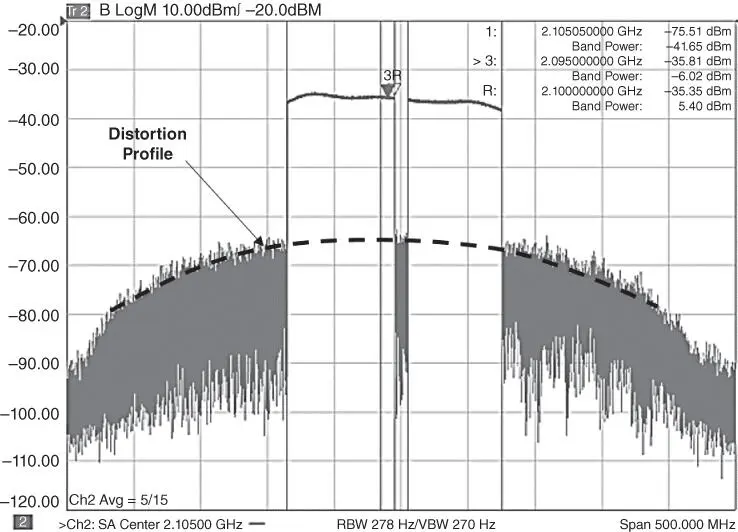
Figure 1.10 An NPR signal showing the total power and ratios of band power.
Apparent in the figure is also the ACLR level, which is nearly the same at the edge of the main signal as the NPR signal in the middle. It is clear from this figure that ACP and NPR are closely related. Imagine, though, if the DUT is followed by a sharp channelizing filter; the ACLR would be removed by the filter and could not be used to determine the distortion but the NPR signal allows one to see the in‐channel distortion. NPR measurements are covered extensively in Chapter 8.
1.6.6 Error Vector Magnitude (EVM)
Error vector magnitude (EVM) is a figure of merit used in communications systems to describe the quality of a modulated signal compared to an idealized signal. In most cases, it is a measure in the so‐called IQ plane of the vector difference between the measured signal and the idealized signal, which is determined by recovering the modulation pattern from the measured signal and re‐creating the idealized signal. It is used when the errors are small and becomes inaccurate with large errors as the recovered signal may not be the correct signal when the EVM is quite large.
The sample point for determining the error is determined by the signaling method, and the idealized signal is time‐shifted to line up with the measured signal to find the difference at the sample point. In some signaling methods, the EVM is determined by taking the fast Fourier transform (FFT) of the modulated signal and idealized signal and measuring the vector difference in the frequency domain.
Читать дальшеИнтервал:
Закладка:
Похожие книги на «Handbook of Microwave Component Measurements»
Представляем Вашему вниманию похожие книги на «Handbook of Microwave Component Measurements» списком для выбора. Мы отобрали схожую по названию и смыслу литературу в надежде предоставить читателям больше вариантов отыскать новые, интересные, ещё непрочитанные произведения.


Обсуждение, отзывы о книге «Handbook of Microwave Component Measurements» и просто собственные мнения читателей. Оставьте ваши комментарии, напишите, что Вы думаете о произведении, его смысле или главных героях. Укажите что конкретно понравилось, а что нет, и почему Вы так считаете.