(1.16) 

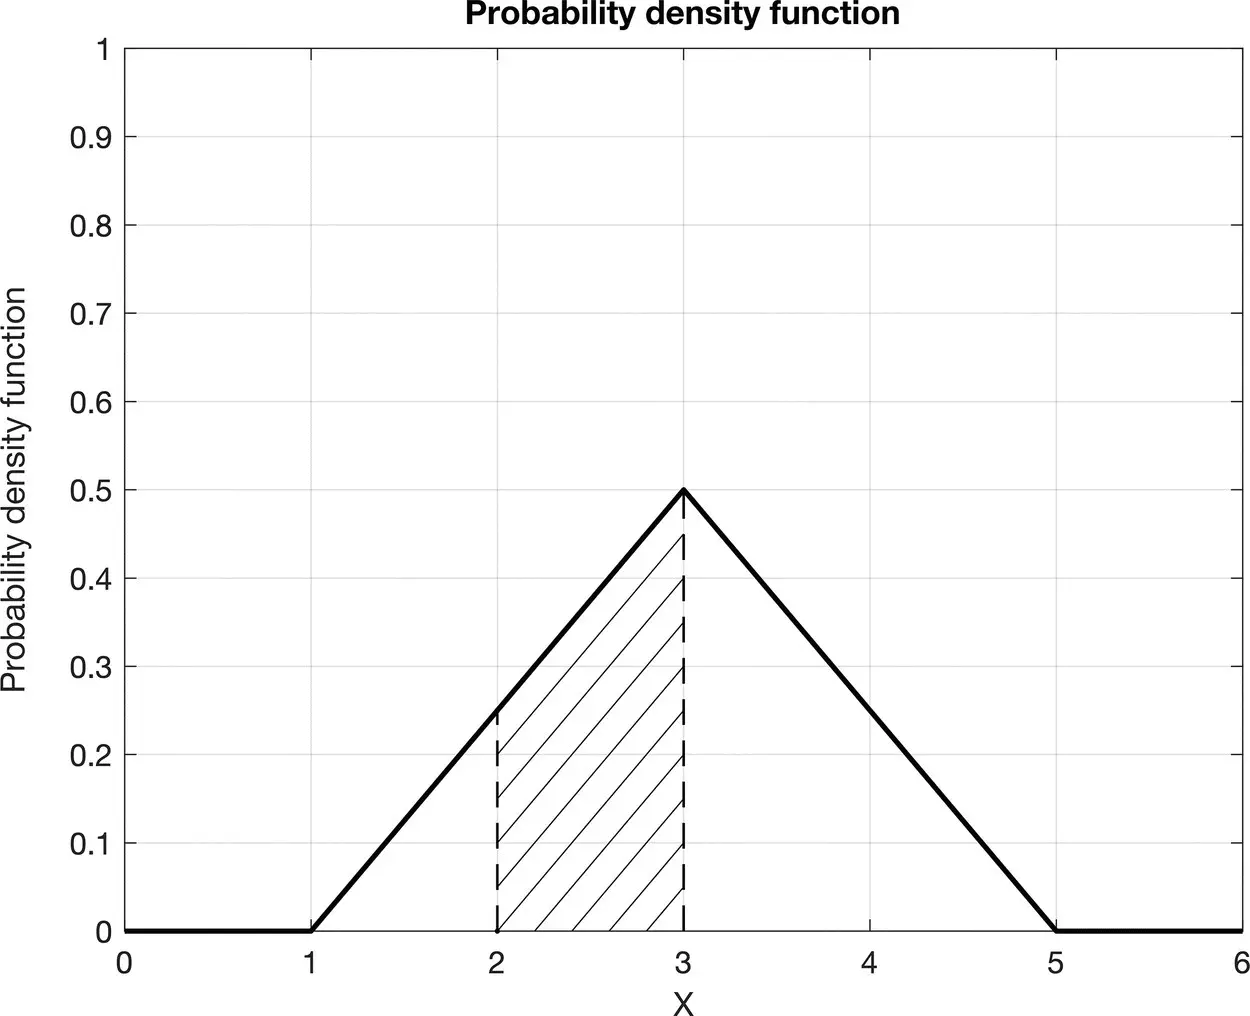
Figure 1.2Graphical interpretation of the probability P (2 < X ≤ 3) of a continuous random variable X as the definite integral of the PDF in the interval (2, 3].
Using the definition in Eq. (1.15), we conclude that F X( x ) is the probability of the random variable X being less than or equal to the outcome x , i.e. F X( x ) = P ( X ≤ x ). As a consequence, we can also define the PDF f X( x ) as the derivative of the CDF, i.e.  .
.
The CDF takes values in the interval [0, 1] and it is non‐decreasing, i.e. if a < b , then F X( a ) ≤ F X( b ). When F X( x ) is strictly increasing, i.e. if a < b , then F X( a ) < F X( b ), we can define its inverse function, namely the quantile (or percentile) function. Given a CDF F X( x ) = p , the quantile function is  and it associates p ∈ [0, 1] to the corresponding value x of the random variable X . The definition of percentile is similar to the definition of quantiles, but using percentages rather than fractions in [0, 1]. For example, the 10th percentile (or P10) corresponds to the quantile 0.10. In many practical applications, we often use quantiles and percentiles. The 25th percentile is the value x of the random variable X such that P ( X ≤ x ) = 0.25, which means that the probability of taking a value lower than or equal to x is 0.25. The 25th percentile is also called the lower quartile. Similarly, the 75th percentile (or P75) is the upper quartile. The 50th percentile (or P50) is called the median of the distribution, since it represents the value x of the random variable X such that there is an equal probability of observing values lower than or equal to x and observing values greater than x , i.e. P ( X ≤ x ) = 0.50 = P ( X > x ).
A continuous random variable is completely defined by its PDF (or by its CDF); however, in some special cases, the probability distribution of the continuous random variable can be described by a finite number of parameters. In this case, the PDF is said to be parametric, because it is defined by its parameters. Examples of parameters are the mean and the variance.
The mean is the most common measure used to describe the expected value that a random variable can take. The mean μ Xof a continuous random variable is defined as:
(1.17) 
The mean μ Xis also called the expected value and it is often indicated as E [ X ]. However, the mean itself is not sufficient to represent the full probability distribution, because it does not contain any measure of the uncertainty of the outcomes of the random variable. A common measure for the uncertainty is the variance  :
:
(1.18) 
The variance  describes the spread of the distribution around the mean. The standard deviation σ Xis the square root of the variance,
  . Other parameters are the skewness coefficient and the kurtosis coefficient (Papoulis and Pillai 2002). The skewness coefficient is a measure of the asymmetry of the probability distribution with respect to the mean, whereas the kurtosis coefficient is a measure of the weight of the tails of the probability distribution.
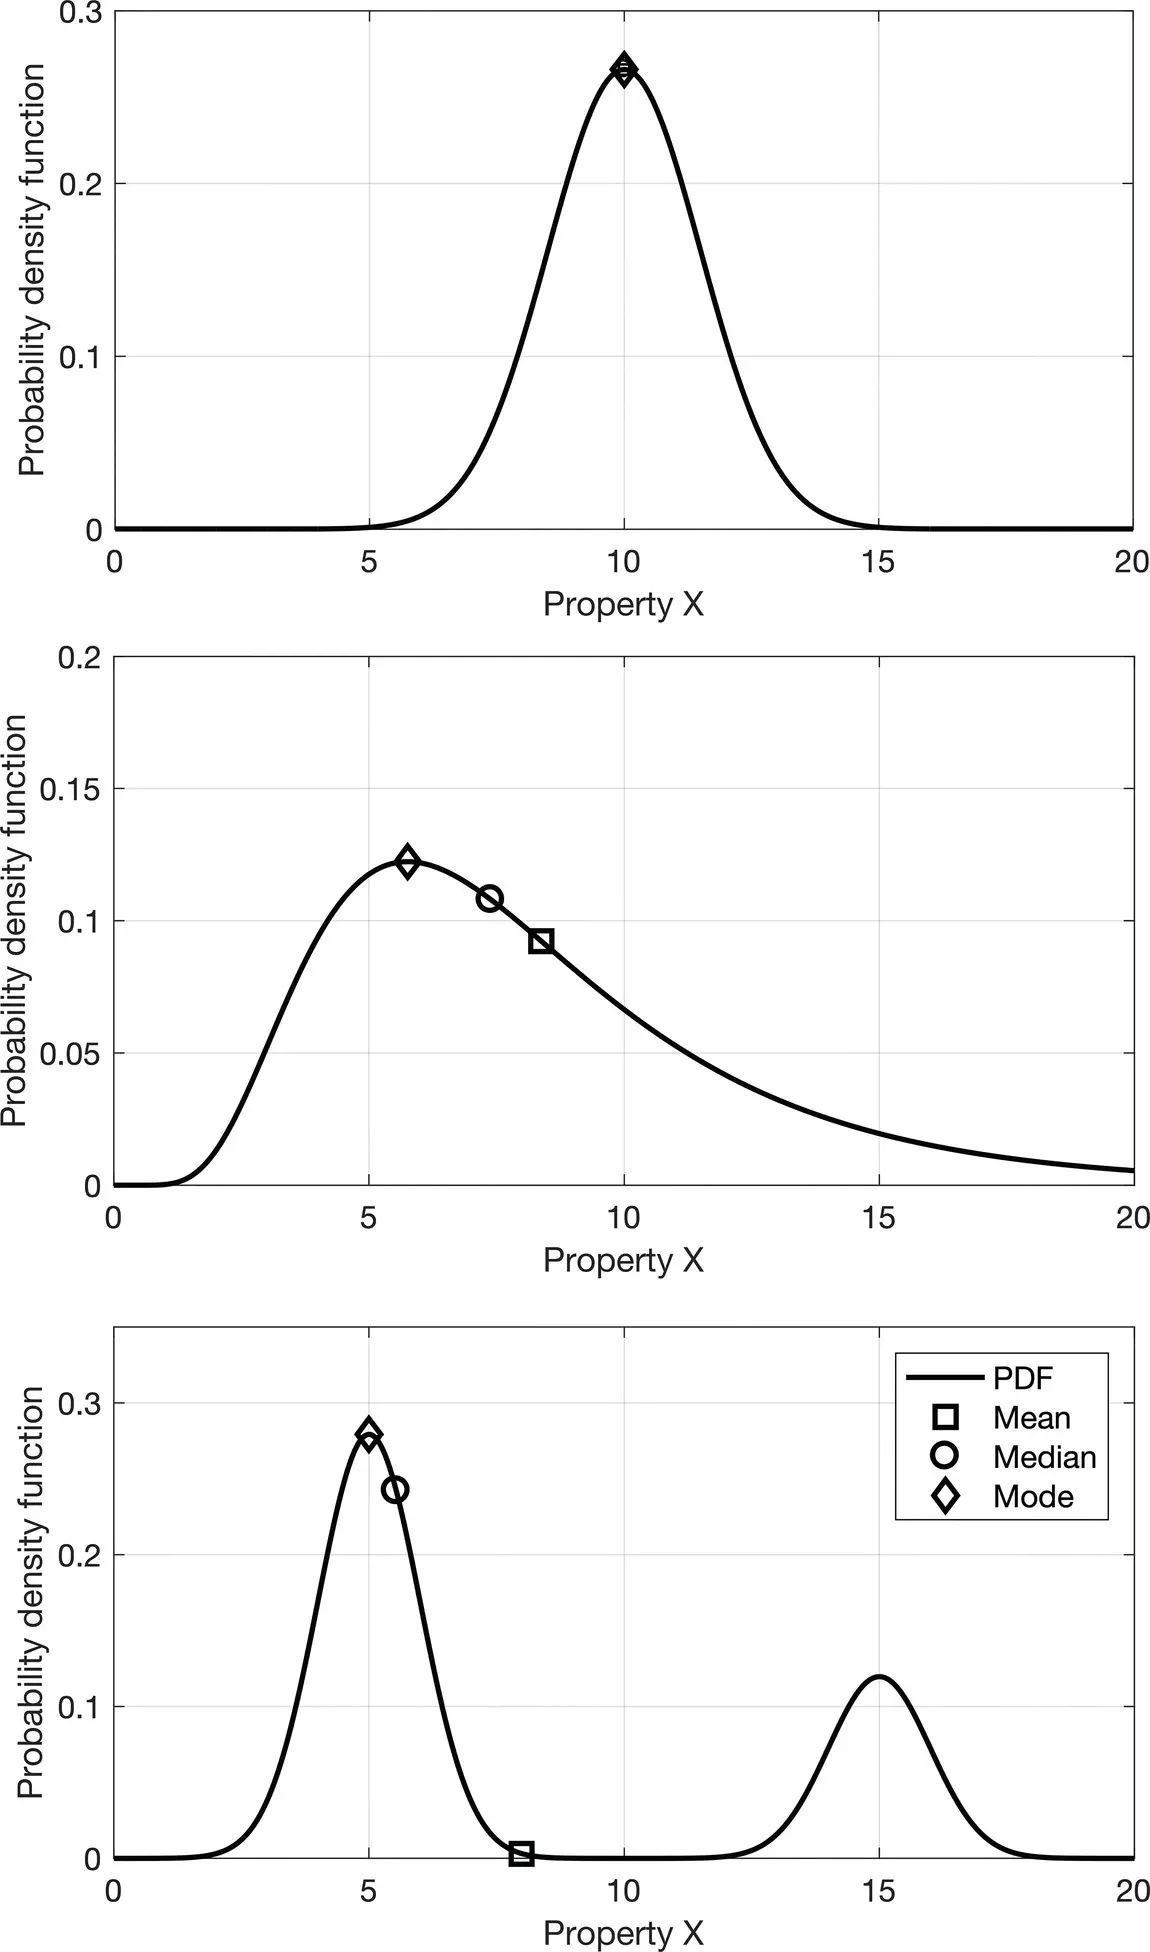
Other useful statistical estimators are the median and the mode. The median is the 50th percentile (or P50) defined using the CDF and it is the value of the random variable that separates the lower half of the distribution from the upper half. The mode of a random variable is the value of the random variable that is associated with the maximum value of the PDF. For a unimodal symmetric distribution, the mean, the median, and the mode are equal, but, in the general case, they do not necessarily coincide. For example, in a skewed distribution the larger the skewness, the larger the difference between the mode and the median. For a multimodal distribution, the mode can be a more representative statistical estimator, because the mean might fall in a low probability region. A comparison of these three statistical estimators is given in Figure 1.3, for symmetric unimodal, skewed unimodal, and multimodal distributions.
The parameters of a probability distribution can be estimated from a set of n observations { x i} i=1,…,n. The sample mean  is an estimate of the mean and it is computed as the average of the data:
(1.19) 

Figure 1.3Comparison of statistical estimators: mean (square), median (circle), and mode (diamond) for different distributions (symmetric unimodal, skewed unimodal, and multimodal distributions).
whereas the sample variance  is estimated as:
(1.20) 
where the constant 1/( n − 1) makes the estimator unbiased (Papoulis and Pillai 2002).
1.3.2 Multivariate Distributions
In many practical applications, we are interested in multiple random variables. For example, in reservoir modeling, we are often interested in porosity and fluid saturation, or P‐wave and S‐wave velocity. To represent multiple random variables and measure their interdependent behavior, we introduce the concept of joint probability distribution. The joint PDF of two random variables X and Y is a function f X,Y: ℝ × ℝ → [0, +∞] such that 0 ≤ f X,Y( x , y ) ≤ +∞ and  .
.
Читать дальше


 .
. and it associates p ∈ [0, 1] to the corresponding value x of the random variable X . The definition of percentile is similar to the definition of quantiles, but using percentages rather than fractions in [0, 1]. For example, the 10th percentile (or P10) corresponds to the quantile 0.10. In many practical applications, we often use quantiles and percentiles. The 25th percentile is the value x of the random variable X such that P ( X ≤ x ) = 0.25, which means that the probability of taking a value lower than or equal to x is 0.25. The 25th percentile is also called the lower quartile. Similarly, the 75th percentile (or P75) is the upper quartile. The 50th percentile (or P50) is called the median of the distribution, since it represents the value x of the random variable X such that there is an equal probability of observing values lower than or equal to x and observing values greater than x , i.e. P ( X ≤ x ) = 0.50 = P ( X > x ).
 :
:
 describes the spread of the distribution around the mean. The standard deviation σ Xis the square root of the variance,
  . Other parameters are the skewness coefficient and the kurtosis coefficient (Papoulis and Pillai 2002). The skewness coefficient is a measure of the asymmetry of the probability distribution with respect to the mean, whereas the kurtosis coefficient is a measure of the weight of the tails of the probability distribution.
 is an estimate of the mean and it is computed as the average of the data:

 is estimated as:
 .
.


