Francis Rouessac - Chemical Analysis
Здесь есть возможность читать онлайн «Francis Rouessac - Chemical Analysis» — ознакомительный отрывок электронной книги совершенно бесплатно, а после прочтения отрывка купить полную версию. В некоторых случаях можно слушать аудио, скачать через торрент в формате fb2 и присутствует краткое содержание. Жанр: unrecognised, на английском языке. Описание произведения, (предисловие) а так же отзывы посетителей доступны на портале библиотеки ЛибКат.
- Название:Chemical Analysis
- Автор:
- Жанр:
- Год:неизвестен
- ISBN:нет данных
- Рейтинг книги:3 / 5. Голосов: 1
-
Избранное:Добавить в избранное
- Отзывы:
-
Ваша оценка:
Chemical Analysis: краткое содержание, описание и аннотация
Предлагаем к чтению аннотацию, описание, краткое содержание или предисловие (зависит от того, что написал сам автор книги «Chemical Analysis»). Если вы не нашли необходимую информацию о книге — напишите в комментариях, мы постараемся отыскать её.
provides an up-to-date overview of the common methods used for qualitative, quantitative, and structural chemical analysis. Assuming no background knowledge in the subject, this student-friendly textbook covers the fundamental principles and practical aspects of more than 20 separation and spectroscopic methods, as well as other important techniques such as elemental analysis, electrochemistry and isotopic labelling methods.
Avoiding technical complexity and theoretical depth, clear and accessible chapters explain the basic concepts of each method and its corresponding instrumental techniques—supported by explanatory diagrams, illustrations, and photographs of commercial instruments. The new edition includes revised coverage of recent developments in supercritical fluid chromatography, capillary electrophoresis, miniaturized sensors, automatic analyzers, digitization and computing power, and more. Offering a well-balanced introduction to a wide range of analytical and instrumentation techniques, this textbook:
Provides a detailed overview of analysis methods used in the chemical and agri-food industries, medical analysis laboratories, and environmental sciences Covers various separation methods including chromatography, electrophoresis and electrochromatography Describes UV and infrared spectroscopy, fluorimetry and chemiluminescence, x-ray fluorescence, nuclear magnetic resonance and other common spectrometric methods such atomic or flame emission, atomic absorption and mass spectrometry Includes concise overview chapters on the general aspects of chromatography, sample preparation strategies, and basic statistical parameters Features examples, end-of-chapter problems with solutions, and a companion website featuring PowerPoint slides for instructors
, is the perfect textbook for undergraduates taking introductory courses in instrumental analytical chemistry, students in chemistry, pharmacy, biochemistry, and environmental science programs looking for information on the techniques and instruments available, and industry technicians working with problems of chemical analysis.
Review of Second Edition “An essential introduction to a wide range of analytical and instrumentation techniques that have been developed and improved in recent years.”
–
Chemical Analysis — читать онлайн ознакомительный отрывок
Ниже представлен текст книги, разбитый по страницам. Система сохранения места последней прочитанной страницы, позволяет с удобством читать онлайн бесплатно книгу «Chemical Analysis», без необходимости каждый раз заново искать на чём Вы остановились. Поставьте закладку, и сможете в любой момент перейти на страницу, на которой закончили чтение.
Интервал:
Закладка:
While this use of chromatography has continued since its origins, this process became a method of analysis with the idea of measuring the retention time of compounds through the column in order to identify them. To do so, it became essential to control certain parameters (flow rate, temperature, etc.) and a detector had to be placed at the column’s outlet to identify compositional changes in the mobile phase. This form of chromatography, whose goal is not simply to recover the components but to measure their retention time, has developed slowly.
The identification of a compound by chromatography is achieved by comparison. To identify a compound, which may be either A or B, using chromatography, we compare its retention time with those for the two reference compounds A and B previously recorded using the same apparatus and the same experimental conditions.

Figure 1.1 A basic experiment in chromatography. (a) The necessary ingredients (C, column; SP, stationary phase; MP, mobile phase and sample); (b) introduction of the sample; (c) start of elution; (d) recovery of the products following separation.
In this experiment, there was no true separation (A and B were pure products), only a comparison of the products’ retention times. However, this method does have three weaknesses: the procedure is fairly slow; absolute identification is unattainable; and the physical contact between the sample and the stationary phase could modify the sample’s properties, in particular the retention times.
This specific method of separation, in its modern form, was first undertaken at the beginning of the twentieth century by the botanist Mikhail Tswett (or Tsvet), who is credited with inventing the terms chromatography and chromatogram .
The technique has improved considerably since its beginnings. Nowadays, chromatographs are piloted by software programs that run highly efficient miniature columns able to separate nano‐quantities of sample. These instruments comprise a complete range of accessories designed to ensure repeatability of successive experiments by the perfect control of the different parameters of separation. Thus it is possible to obtain, during successive analyses of the same sample conducted several hours apart, recordings that are reproducible to within a second ( Figure 1.2).
The specific recording that is obtained for each separation is called a chromatogram . It corresponds to a two‐dimensional diagram that reveals the variations of composition of the eluting mobile phase as it exits the column. To obtain this read‐out, a sensor, or detector , of which there exists a great variety, needs to be placed at the outlet of the column.
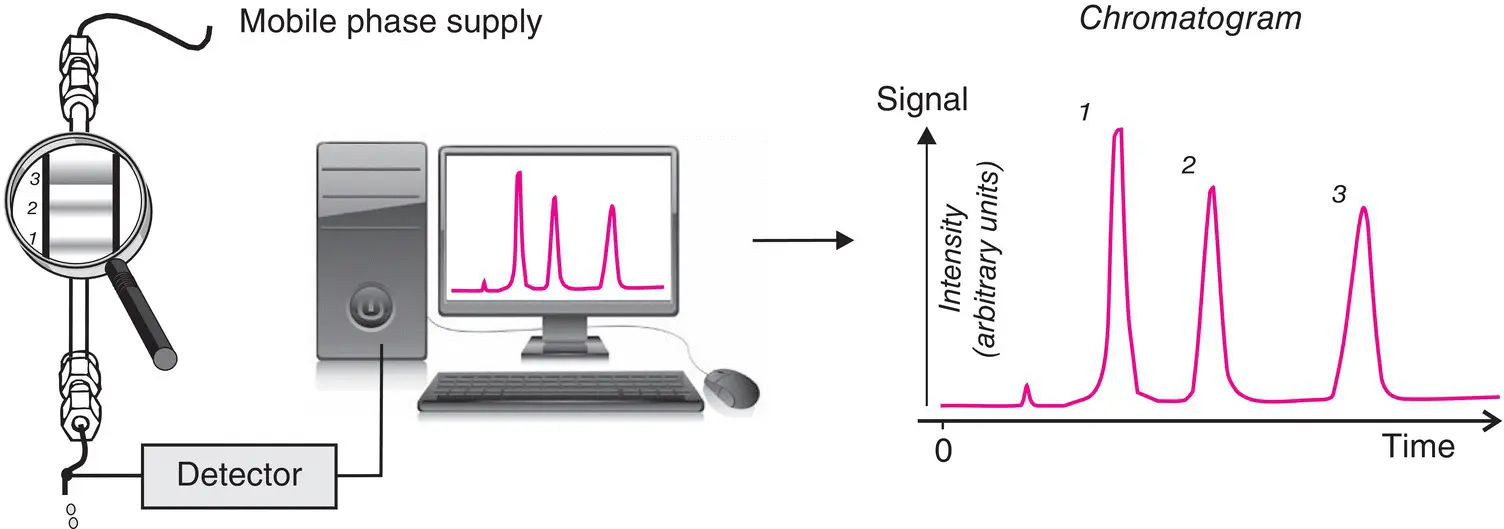
Figure 1.2 The principle of analysis by chromatography. The chromatogram, the essential graph of every chromatographic analysis, is obtained from variations, as a function of time, of an electrical signal emitted by the detector. It is either produced in real time or reconstructed at a later time from values that have been digitized and stored. The chromatography software recalculates these values and puts them in the desired format. This chromatogram illustrates the separation of a mixture of three principal components. Note that the order of appearance of the compounds corresponds to the relative position of each constituent on the column.
The identification of a molecular compound from the chromatogram can sometimes be risky. A better method consists in associating two different complementary methods, for example, a chromatograph coupled with a second instrument, such as a mass spectrometer or an infrared spectrometer. These coupled (or two‐dimensional) techniques provide two independent types of information (retention times and the spectrum). Therefore, it is possible to determine without ambiguity the composition of complex mixtures or the concentration of certain compounds on the nanogram level (confirmation analyses).
1.2 THE CHROMATOGRAM
The chromatogram is a curve representing the variation over time of a parameter related to the concentration or quantity of the solute at the column outlet ( Figure 1.3). Time (or very rarely the elution volume ) is found on the horizontal axis, where the time origin coincides with the introduction of the sample in the injection system. The detector response is found on the vertical axis. The baseline corresponds to the detector response in the absence of any solute. The separation is complete between two compounds when the chromatogram shows two chromatographic peaks that start from and return to the baseline.
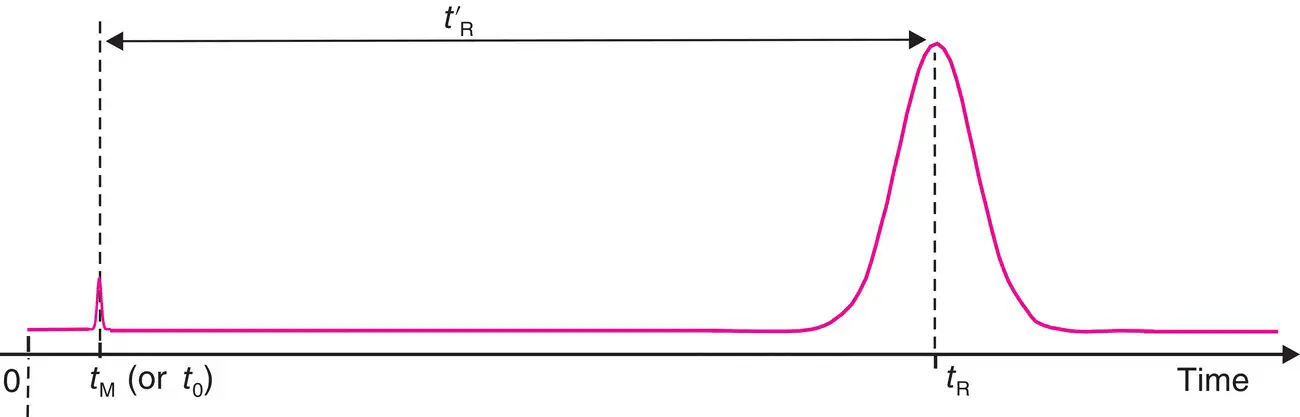
Figure 1.3 Chromatographic elution curve. Example of a graph of Eq. (1.1).
A component is characterized by its retention time t R, which represents the time elapsed between sample introduction and the detection of its peak maximum on the chromatogram. In an ideal case, t Ris independent of the quantity injected. The longer the retention time, the wider the peak is.
A component that is not retained will elute out of the column at time t M, called the hold‐up time or dead time 1 (also designated t 0). The difference between the retention time and the hold‐up is referred to as the adjusted retention time of the compound t’ R.
In quantitative analysis, we often simply separate the mixture from the compound(s) to be assayed. If the signal sent by the sensor varies linearly with the concentration of a compound, then the same variation will occur for the area under the corresponding peak on the chromatogram.
1.3 GAUSSIAN PEAKS AND REAL PEAKS
On a chromatogram, the ideal elution peak would have the same form as the graphical representation of the normal distribution of random errors (Gaussian curve). In keeping with the classic notation, μ corresponds to the retention time of the eluting peak and σ to the standard deviation of the peak ( σ 2represents the variance ). y represents the signal as a function of time x from the detector located at the outlet of the column ( Figure 1.4).
This is why ideal elution peak signals of a compound are usually described by the probability density function ( Eq. (1.2)).
Equation ( 1.1) is a mathematical relationship describing a Gaussian function, whatever the x variable. In this expression, σ represents the width unit to describe the peak and μ corresponds to the horizontal axis of the Gaussian curve (in this case, retention time t R). If we make the peak symmetry axis correspond with the new time origin ( μ or t R= 0), we obtain Eq. (1.2)).
(1.1) 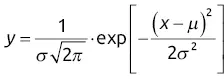
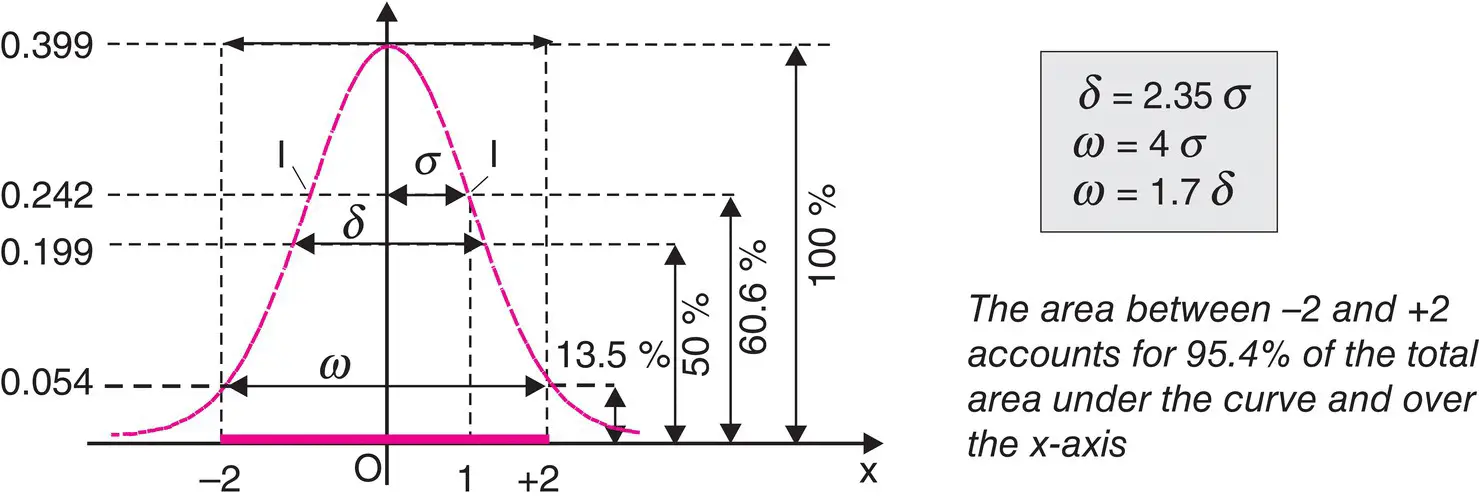
Figure 1.4 Characteristics of an ideal chromatographic peak. Meaning of the three classic parameters and summary of characteristics of a Gaussian curve.
Читать дальшеИнтервал:
Закладка:
Похожие книги на «Chemical Analysis»
Представляем Вашему вниманию похожие книги на «Chemical Analysis» списком для выбора. Мы отобрали схожую по названию и смыслу литературу в надежде предоставить читателям больше вариантов отыскать новые, интересные, ещё непрочитанные произведения.


![Евгений Матерёв - Музеи… или вдохновляющая музыка The Chemical Brothers [litres самиздат]](/books/437288/evgenij-materev-muzei-ili-vdohnovlyayuchaya-muzyka-th-thumb.webp)


Обсуждение, отзывы о книге «Chemical Analysis» и просто собственные мнения читателей. Оставьте ваши комментарии, напишите, что Вы думаете о произведении, его смысле или главных героях. Укажите что конкретно понравилось, а что нет, и почему Вы так считаете.