Francis Rouessac - Chemical Analysis
Здесь есть возможность читать онлайн «Francis Rouessac - Chemical Analysis» — ознакомительный отрывок электронной книги совершенно бесплатно, а после прочтения отрывка купить полную версию. В некоторых случаях можно слушать аудио, скачать через торрент в формате fb2 и присутствует краткое содержание. Жанр: unrecognised, на английском языке. Описание произведения, (предисловие) а так же отзывы посетителей доступны на портале библиотеки ЛибКат.
- Название:Chemical Analysis
- Автор:
- Жанр:
- Год:неизвестен
- ISBN:нет данных
- Рейтинг книги:3 / 5. Голосов: 1
-
Избранное:Добавить в избранное
- Отзывы:
-
Ваша оценка:
Chemical Analysis: краткое содержание, описание и аннотация
Предлагаем к чтению аннотацию, описание, краткое содержание или предисловие (зависит от того, что написал сам автор книги «Chemical Analysis»). Если вы не нашли необходимую информацию о книге — напишите в комментариях, мы постараемся отыскать её.
provides an up-to-date overview of the common methods used for qualitative, quantitative, and structural chemical analysis. Assuming no background knowledge in the subject, this student-friendly textbook covers the fundamental principles and practical aspects of more than 20 separation and spectroscopic methods, as well as other important techniques such as elemental analysis, electrochemistry and isotopic labelling methods.
Avoiding technical complexity and theoretical depth, clear and accessible chapters explain the basic concepts of each method and its corresponding instrumental techniques—supported by explanatory diagrams, illustrations, and photographs of commercial instruments. The new edition includes revised coverage of recent developments in supercritical fluid chromatography, capillary electrophoresis, miniaturized sensors, automatic analyzers, digitization and computing power, and more. Offering a well-balanced introduction to a wide range of analytical and instrumentation techniques, this textbook:
Provides a detailed overview of analysis methods used in the chemical and agri-food industries, medical analysis laboratories, and environmental sciences Covers various separation methods including chromatography, electrophoresis and electrochromatography Describes UV and infrared spectroscopy, fluorimetry and chemiluminescence, x-ray fluorescence, nuclear magnetic resonance and other common spectrometric methods such atomic or flame emission, atomic absorption and mass spectrometry Includes concise overview chapters on the general aspects of chromatography, sample preparation strategies, and basic statistical parameters Features examples, end-of-chapter problems with solutions, and a companion website featuring PowerPoint slides for instructors
, is the perfect textbook for undergraduates taking introductory courses in instrumental analytical chemistry, students in chemistry, pharmacy, biochemistry, and environmental science programs looking for information on the techniques and instruments available, and industry technicians working with problems of chemical analysis.
Review of Second Edition “An essential introduction to a wide range of analytical and instrumentation techniques that have been developed and improved in recent years.”
–
Chemical Analysis — читать онлайн ознакомительный отрывок
Ниже представлен текст книги, разбитый по страницам. Система сохранения места последней прочитанной страницы, позволяет с удобством читать онлайн бесплатно книгу «Chemical Analysis», без необходимости каждый раз заново искать на чём Вы остановились. Поставьте закладку, и сможете в любой момент перейти на страницу, на которой закончили чтение.
Интервал:
Закладка:
(1.2) 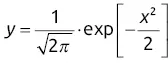
This function is characterized by a symmetrical curve (maximum at x = 0, y = 0.399) possessing two inflection points at x = ±1 ( Figure 1.4), whose y‐value is 0.242 (i.e. 60.6% of the maximum value). The width of the curve at the inflection points is equal to 2 σ ( σ = 1).
In chromatography, δ represents the full width at half‐maximum (FWHM, δ = 2.35 σ ) and σ 2the variance of the peak. The width of the peak ‘at the base’ is labelled ω and corresponds to the base of the triangle formed from the tangents to the inflection point I of the Gaussian curve. It is measured at 13.5% of the peak height. At this position, for a Gaussian curve, ω = 4 σ by definition.
Real chromatographic peaks often deviate significantly from the ideal Gaussian form. There are several reasons for this. In particular, the peak’s half‐width at the inflection point is not only due to elution in the column but also to injection and detection, which we summarize with the following expression:
(1.3) 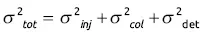
where σ 2 tot, σ 2 inj, σ 2 col, σ 2 detare, respectively, the total variance (as observed experimentally), the variance due to injection (injection time, time for the sample to penetrate into the column), the variance due to the column (elution), and the variance due to detection (dead volume between column outlet and detector, detector response time, etc.).
1.4 PLATE THEORY
For more than half a century, different theories have been and continue to be proposed to model chromatography. The best known are those employing a statistical approach (stochastic theory), the theoretical plate model or a molecular dynamics approach.
To explain the mechanism of migration and separation of compounds on the column, the oldest model, known as Craig’s theoretical plate model , is a static approach now judged to be obsolete, but which once offered a simple description of the separation of constituents.
Although chromatography is a continuous phenomenon, Craig’s model considered that each solute moves progressively along a sequence of distinct static steps. This elementary process is represented by a cycle of adsorption/desorption. The continuity of these steps reproduces the migration of the compounds on the column, in a similar fashion to that achieved by an animated film, giving the illusion of movement through a sequence of fixed images. Each step corresponds to a new state of equilibrium for the entire column.
These successive equilibria provide the basis of plate theory according to which a column of length L is sliced horizontally into N fictitious, small plate‐like discs of the same height H and numbered from 1 to n . For each of them, the concentration of the solute in the mobile phase is in equilibrium with the concentration of this solute in the stationary phase. At each new equilibrium, the solute has progressed through the column by a distance of one disc (or plate), hence the name theoretical plate theory .
The height equivalent to a theoretical plate (HETP or H ) will be given by:
(1.4) 
This approach employs the rules of polynomial expansion to calculate, for a given plate, the masses distributed between the two phases present. This theory has a major fault in that it does not take into account the dispersion in the column due to the diffusion of the compounds.
The term theoretical plate comes from an early approach to describe chromatography by analogy with the distillation model proposed by Martin and Synge (Nobel laureates in Chemistry, 1952). This term, though widely used in chromatography for historical reasons, has no physical significance, in contrast to its homonym which serves to measure the performance of a distillation column. It may have been better to name it after Tswett, for example!
The total retention time t Rof the solute on the column can be subdivided into two terms: t M(hold‐up time), which includes the times during which the solute is dissolved in the mobile phase and travels at the same speed as this phase, and t S, the time during which it is attached to the stationary phase. Between two successive transfers from one phase to the other, it is accepted that the concentrations have the time to re‐equilibrate.
Chromatography involves at least three sets of equilibria: solute/mobile phase, solute/stationary phase, and mobile phase/stationary phase. In a more recent theory of chromatography, it is no longer claimed that the molecules are immobilized by the stationary phase, but rather that they are simply slowed down when passing in close proximity to it.
Various physical phenomena may reveal an asymmetry in the chromatographic peak. More specifically, there is a concentration irregularity in the substance deposit zone at the column head. Moreover, the speed of the mobile phase is null on the wall and at a maximum in the centre of the column. The observed asymmetry of a peak is represented by two parameters: one named the peak asymmetry factor ( F a) ( Eq. (1.5)), measured at 10% of the peak height, and the other named tailing factor ( F t) ( Eq. (1.6)) measured at 5% of peak height (for the meaning of a and b in these equations, see Figure 1.5).
(1.5) 
(1.6) 
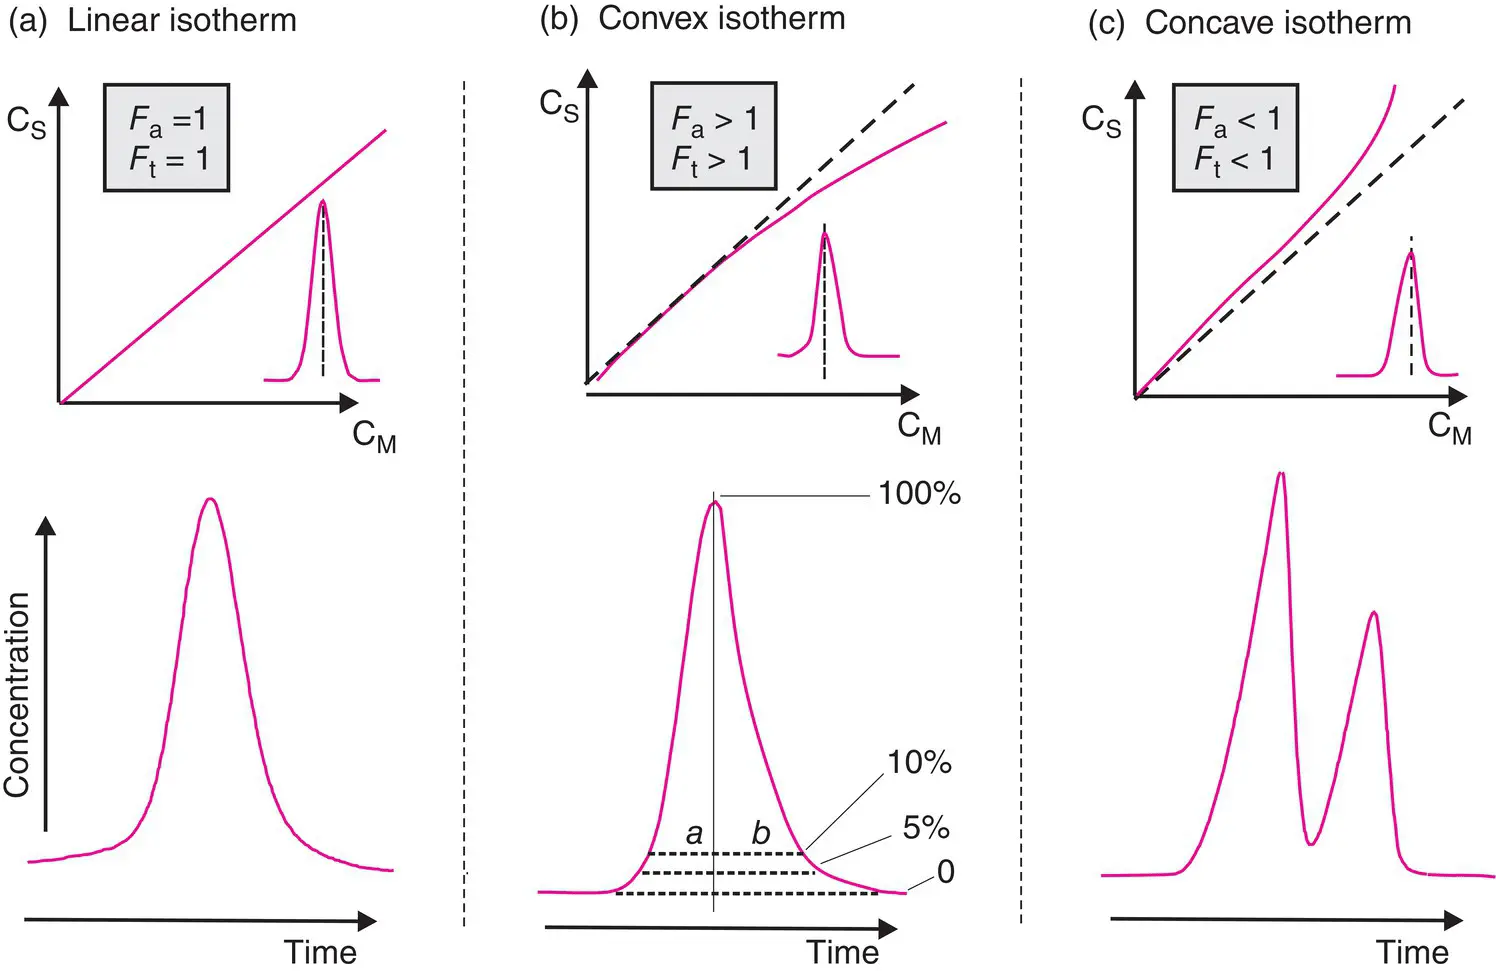
Figure 1.5 Distribution isotherms. (a) The ideal situation corresponding to the invariance of the concentration isotherm. (b) Situation in which the stationary phase is saturated – as a result, the ascent of the peak is faster than the descent. (c) The opposite situation: the component is retained too long by the stationary phase, the retention time is therefore extended, and the ascent of the peak is slower than the descent. For each type of column, the manufacturers indicate its capacity limit, expressed in ng/compound, prior to a potential deformation of the corresponding peak. The three situations are illustrated by authentic chromatograms.
1.5 NERNST PARTITION COEFFICIENT ( K )
The fundamental physico‐chemical parameter of chromatography is the equilibrium constant K , termed the partition coefficient , quantifying the ratio of the concentrations of each compound in the two phases.
(1.7) 
Values of K are quite variable. The higher they are, the more solute is retained. At least for liquid chromatography, they depend on the intensity of three types of interactions: stationary phase/solute, mobile phase/solute, and mobile phase/stationary phase.
Читать дальшеИнтервал:
Закладка:
Похожие книги на «Chemical Analysis»
Представляем Вашему вниманию похожие книги на «Chemical Analysis» списком для выбора. Мы отобрали схожую по названию и смыслу литературу в надежде предоставить читателям больше вариантов отыскать новые, интересные, ещё непрочитанные произведения.


![Евгений Матерёв - Музеи… или вдохновляющая музыка The Chemical Brothers [litres самиздат]](/books/437288/evgenij-materev-muzei-ili-vdohnovlyayuchaya-muzyka-th-thumb.webp)


Обсуждение, отзывы о книге «Chemical Analysis» и просто собственные мнения читателей. Оставьте ваши комментарии, напишите, что Вы думаете о произведении, его смысле или главных героях. Укажите что конкретно понравилось, а что нет, и почему Вы так считаете.