Joel P. Dunsmore - Handbook of Microwave Component Measurements
Здесь есть возможность читать онлайн «Joel P. Dunsmore - Handbook of Microwave Component Measurements» — ознакомительный отрывок электронной книги совершенно бесплатно, а после прочтения отрывка купить полную версию. В некоторых случаях можно слушать аудио, скачать через торрент в формате fb2 и присутствует краткое содержание. Жанр: unrecognised, на английском языке. Описание произведения, (предисловие) а так же отзывы посетителей доступны на портале библиотеки ЛибКат.

- Название:Handbook of Microwave Component Measurements
- Автор:
- Жанр:
- Год:неизвестен
- ISBN:нет данных
- Рейтинг книги:5 / 5. Голосов: 1
-
Избранное:Добавить в избранное
- Отзывы:
-
Ваша оценка:
Handbook of Microwave Component Measurements: краткое содержание, описание и аннотация
Предлагаем к чтению аннотацию, описание, краткое содержание или предисловие (зависит от того, что написал сам автор книги «Handbook of Microwave Component Measurements»). Если вы не нашли необходимую информацию о книге — напишите в комментариях, мы постараемся отыскать её.
Handbook of Microwave Component Measurements — читать онлайн ознакомительный отрывок
Ниже представлен текст книги, разбитый по страницам. Система сохранения места последней прочитанной страницы, позволяет с удобством читать онлайн бесплатно книгу «Handbook of Microwave Component Measurements», без необходимости каждый раз заново искать на чём Вы остановились. Поставьте закладку, и сможете в любой момент перейти на страницу, на которой закончили чтение.
Интервал:
Закладка:
Older mm‐wave broadband systems (not shown) placed the combiner in front of the mm‐port. This allowed the use of a full waveguide coupler in the head (which of course cannot pass low frequencies), but the loss of the combiner at the output leads to system instabilities, and this style of broadband head has largely been obsoleted.
One version of mm‐heads, so‐called banded‐heads, typically use waveguide‐based couplers and cover only the waveguide band. The test port is a waveguide as well. These heads have only a single source and LO multiplier, and of course they have no low frequency path at all. Banded heads operate over nearly all the waveguide bands from V band (50–75) up to THz frequencies of 1.5 THz.
The reference and test IF paths, just like in the broadband head, are returned to the base box for signal conditioning and detection in the digital IF.
Figure 2.31shows a picture of a broadband, 4‐port mm‐wave system. This particular unit allows measurements from 900 Hz to 130 GHz, with full S‐parameter calibration as well as other features of modern VNA such as broadband spectrum analysis (see Chapter 8) and noise figure capability. The long test umbilical contains a composite cable that has all the RF and IF cables plus DC bias, DC power, and switch control. The switch control is needed to switch between filter paths in the head to maintain a good level of spurious performance. The length is needed as these systems are often used in on‐wafer applications. Fortunately, because the test port couplers are inside the head, there is good stability even with the long interface cables.
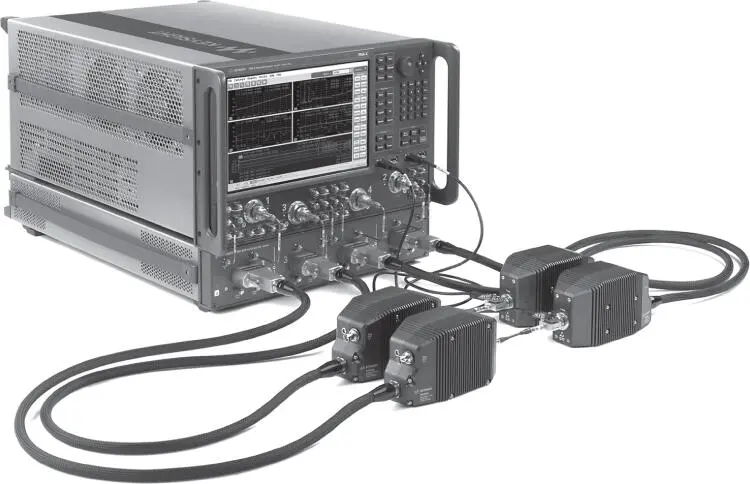
Figure 2.31 A 4‐port, 900 Hz to 130 GHz VNA system using mm‐wave extenders.
Source: Photo courtesy of Keysight Technologies.
2.3 VNA Measurement of Linear Microwave Parameters
In this section the fundamentals of making microwave measurements are discussed for a variety of parameters, along with the consequences of the practical limitations of the RF hardware detailed in the previous section. This section discusses measurement methods and the sources of errors and other complications to making microwave measurements related to test equipment limitations.
2.3.1 Measurement Limitations of the VNA
The systematic error terms (described in Chapter 3) are well known, and many methods are used to essentially eliminate their effects on the S‐parameter measurement results. However, other hardware limitations in a VNA are cannot be so easily removed, and special care must be taken to diminish the effects of these limitations.
2.3.1.1 Noise Floor
The consideration of system noise floor is often not included in the specifications of measurement accuracy, under the assumption that noise effects can be eliminated with sufficient reduction in IF bandwidth or increase in averaging factor. While this is theoretically true, in many circumstances the increase in measurement time makes this impractical. In some situations, such as real‐time tuning of microwave filters, the IF bandwidth must be increased to achieve a real‐time update rate. The noise effects increase 10 dB for each 10× increase in IF BW, so it is a simple matter to compute the effective noise floor at any IF BW given a noise floor at some IF BW, typically 10 Hz.
There exist two distinct noise effects in S‐parameter measurements: noise floor and high‐level trace noise. The noise floor is easily understood as the effect of added noise at the input of the receiver, due to the noise figure of the VNA receiver. The coupling factor of the test port coupler reduces the measured signal further so that the effect of noise floor is more dominant. The effect of noise floor on a measurement can be determined by taking the RMS noise floor, converting it to an equivalent linear amplitude wave, and then adding it to the amplitude of the signal at the measured receiver.
The conversion to the linear b 2noise is
(2.9) 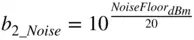
Note that the raw measured noise floor on a VNA receiver will be the square root of the noise power, as the a and b waves are in units of square root of power.
Often, the noise floor of a VNA is expressed as a dBc value relative to a 0 dB insertion loss measurement. Of course, for a constant noise power in the receiver, the relative noise floor will depend upon the source drive power.
The RMS trace noise apparent on an S‐parameter trace can be computed by adding the RMS noise floor to the amplitude of the signal at the b receiver.
(2.10) 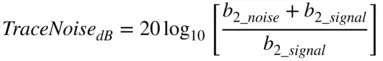
when the noise floor is sufficiently below the measurement of interest. Of course, when the noise floor is above the measured value, the measurement becomes meaningless.
Take, for example, a filter with 80 dB of insertion loss (S21 = −80 dB), with a drive power from the source of 0 dBm, a VNA with an RMS noise floor of −127 dBm in a 10 Hz bandwidth. If it is measured using a 10 kHz IF bandwidth, as shown in Figure 2.32, the trace noise due to noise floor at any insertion loss can be computed.
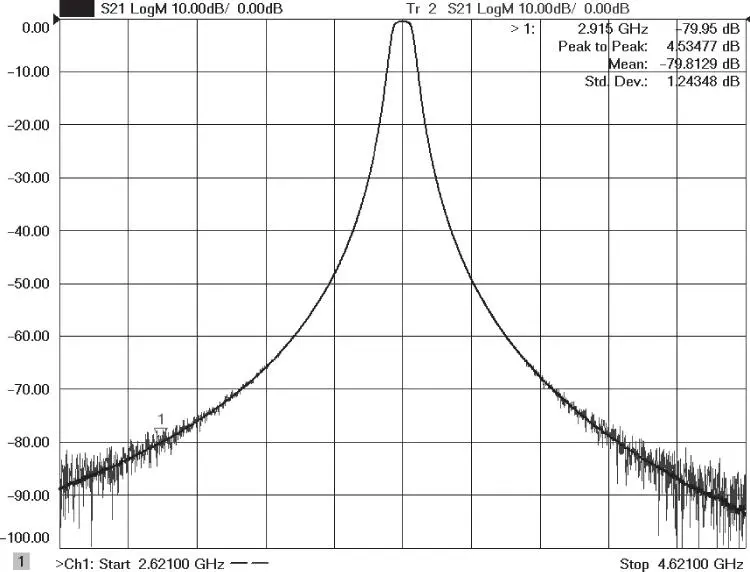
Figure 2.32 Effects of noise floor on an S21 measurement.
The effective noise floor is 30 dB greater than the 10 Hz spec, for a level of −97 dBm. The measured b 2noise would be
(2.11) 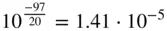
The output signal is
(2.12) 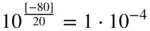
The RMS trace noise level would then be
(2.13) 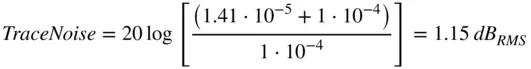
This value is close to the measured trace noise, shown as trace statistics computed near Marker 1 on Figure 2.32and displayed as SDEV = 1.24 dB (trace statistics measures the variation of signal of a trace, and in this case the computation is restricted to be a 5% region near the marker position). Thus, one would see substantial noise on the filter stopband measurement. The RMS trace noise represents one standard deviation of noise. For this example, about 21 points are used to compute the trace noise near the marker. One would expect a peak‐to‐peak trace noise of about four standard deviations in the worst case or approximately 4.6 dB of peak‐to‐peak noise on a typical measurement. However, since noise can take on any value for any single instance, the RMS value is almost always used when describing noise‐related values. As the S‐parameter signal rises above the noise floor of the VNA, trace noise diminishes at a rate of about three times (in dB) for each 10 dB increase in signal level. But this 3‐for‐10 reduction doesn't continue at high signal levels.
Читать дальшеИнтервал:
Закладка:
Похожие книги на «Handbook of Microwave Component Measurements»
Представляем Вашему вниманию похожие книги на «Handbook of Microwave Component Measurements» списком для выбора. Мы отобрали схожую по названию и смыслу литературу в надежде предоставить читателям больше вариантов отыскать новые, интересные, ещё непрочитанные произведения.


Обсуждение, отзывы о книге «Handbook of Microwave Component Measurements» и просто собственные мнения читателей. Оставьте ваши комментарии, напишите, что Вы думаете о произведении, его смысле или главных героях. Укажите что конкретно понравилось, а что нет, и почему Вы так считаете.