Spectroscopy for Materials Characterization
Здесь есть возможность читать онлайн «Spectroscopy for Materials Characterization» — ознакомительный отрывок электронной книги совершенно бесплатно, а после прочтения отрывка купить полную версию. В некоторых случаях можно слушать аудио, скачать через торрент в формате fb2 и присутствует краткое содержание. Жанр: unrecognised, на английском языке. Описание произведения, (предисловие) а так же отзывы посетителей доступны на портале библиотеки ЛибКат.

- Название:Spectroscopy for Materials Characterization
- Автор:
- Жанр:
- Год:неизвестен
- ISBN:нет данных
- Рейтинг книги:5 / 5. Голосов: 1
-
Избранное:Добавить в избранное
- Отзывы:
-
Ваша оценка:
Spectroscopy for Materials Characterization: краткое содержание, описание и аннотация
Предлагаем к чтению аннотацию, описание, краткое содержание или предисловие (зависит от того, что написал сам автор книги «Spectroscopy for Materials Characterization»). Если вы не нашли необходимую информацию о книге — напишите в комментариях, мы постараемся отыскать её.
Learn foundational and advanced spectroscopy techniques from leading researchers in physics, chemistry, surface science, and nanoscience Spectroscopy for Materials Characterization,
Simonpietro Agnello
Spectroscopy for Materials Characterization
Spectroscopy for Materials Characterization — читать онлайн ознакомительный отрывок
Ниже представлен текст книги, разбитый по страницам. Система сохранения места последней прочитанной страницы, позволяет с удобством читать онлайн бесплатно книгу «Spectroscopy for Materials Characterization», без необходимости каждый раз заново искать на чём Вы остановились. Поставьте закладку, и сможете в любой момент перейти на страницу, на которой закончили чтение.
Интервал:
Закладка:
This distribution of energy density in the electromagnetic field should coincide with the Planck’s law at thermal equilibrium. As a consequence, by equating (1.32)and (1.24), it is found that
(1.33) 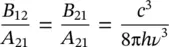
and, finally
(1.34) 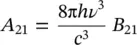
(1.35) 
In the case of degenerate energy levels with degeneracy g 1and g 2, it is shown that (1.35)transforms into
(1.36) 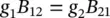
whereas (1.34)remains unchanged [8, 13].
Using the quantum mechanical treatment of the interaction between radiation and matter and, in particular, neglecting any magnetic contribution and considering the electric dipole approximation, the atom can be described by a dipole moment
(1.37) 
where e is the electron charge (1.602 ⋅ 10 −19C) and ris its position vector with respect to the atomic nucleus. The time‐dependent perturbation theory enables to show that the probability to populate the higher energy level of the atom E 2(multiplied by unit frequency interval), starting from the level with energy E 1, is given by [8, 9, 13]:
(1.38) 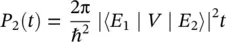
where V is the interaction energy between the electric field and the electric dipole moment:
(1.39) 
and ℏ = h /2π. Considering a linearly polarized lightwave with electric field of amplitude  0, wavevector k, and angular frequency ω = 2π ν
(1.40) 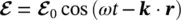
the probability of population of the excited state per unit of time, coinciding with the transition rate, is then given by
(1.41) 
in which the electric dipole matrix element μ 12relative to the considered atomic states in the direction of the external field has been introduced. Using (1.29), it is possible to find that
(1.42) 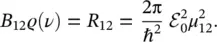
This result shows a connection between the macroscopic empiric quantities and the microscopic ones related to the quantum mechanical states of the electron in the atom. In particular, it is shown that the transition probability is related to the electric dipole matrix element μ 12.
Considering that in vacuum [8, 13]
(1.43) 
ε 0being the permittivity of free space (8.854 × 10 −12kg −1m −3s 4A 2), it is possible to find that
(1.44) 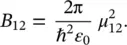
Furthermore, since the intensity of radiation and the energy density are related by [1, 8, 13]
(1.45) 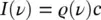
using (1.42), it is found that the transition rate between the atom’s energy states is given by
(1.46) 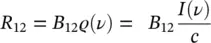
a connection with the intensity of radiation is made explicit now. The rate of energy absorbed per unit of volume by the atom from the electromagnetic field can then be written as
(1.47) 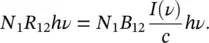
By assuming that all the atoms reside in the N 1state, this is the energy lost by the radiation field. If a sample of thickness d x is considered, the energy lost for unit area by the electromagnetic wave is then
(1.48) 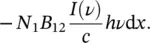
By recalling the Lambert–Beer law in differential form from (1.1), it is shown that
(1.49) 
where the frequency dependence has been inserted, and finally one obtains
(1.50) 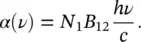
This is a more direct connection between experimental parameters and the microscopic ones. In fact, by using (1.44), it is found that
(1.51) 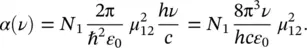
Integrating (1.51)over the entire frequency range pertaining to the given atomic (or molecular) species gives
(1.52) 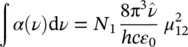
where the central absorption frequency  has been introduced that is usually related to the maximum of the absorption band. This expression shows that absorption measurements give information on the electric dipole matrix element μ 12once the concentration of absorbing centers N 1is known. The connection reported in (1.41)with the electronic states’ wave functions enables to obtain information about them and vice versa, i.e. once the dipole matrix element is known, from the integral of the absorption band, the concentration of absorbing centers can be found.
Интервал:
Закладка:
Похожие книги на «Spectroscopy for Materials Characterization»
Представляем Вашему вниманию похожие книги на «Spectroscopy for Materials Characterization» списком для выбора. Мы отобрали схожую по названию и смыслу литературу в надежде предоставить читателям больше вариантов отыскать новые, интересные, ещё непрочитанные произведения.


Обсуждение, отзывы о книге «Spectroscopy for Materials Characterization» и просто собственные мнения читателей. Оставьте ваши комментарии, напишите, что Вы думаете о произведении, его смысле или главных героях. Укажите что конкретно понравилось, а что нет, и почему Вы так считаете.