Spectroscopy for Materials Characterization
Здесь есть возможность читать онлайн «Spectroscopy for Materials Characterization» — ознакомительный отрывок электронной книги совершенно бесплатно, а после прочтения отрывка купить полную версию. В некоторых случаях можно слушать аудио, скачать через торрент в формате fb2 и присутствует краткое содержание. Жанр: unrecognised, на английском языке. Описание произведения, (предисловие) а так же отзывы посетителей доступны на портале библиотеки ЛибКат.

- Название:Spectroscopy for Materials Characterization
- Автор:
- Жанр:
- Год:неизвестен
- ISBN:нет данных
- Рейтинг книги:5 / 5. Голосов: 1
-
Избранное:Добавить в избранное
- Отзывы:
-
Ваша оценка:
Spectroscopy for Materials Characterization: краткое содержание, описание и аннотация
Предлагаем к чтению аннотацию, описание, краткое содержание или предисловие (зависит от того, что написал сам автор книги «Spectroscopy for Materials Characterization»). Если вы не нашли необходимую информацию о книге — напишите в комментариях, мы постараемся отыскать её.
Learn foundational and advanced spectroscopy techniques from leading researchers in physics, chemistry, surface science, and nanoscience Spectroscopy for Materials Characterization,
Simonpietro Agnello
Spectroscopy for Materials Characterization
Spectroscopy for Materials Characterization — читать онлайн ознакомительный отрывок
Ниже представлен текст книги, разбитый по страницам. Система сохранения места последней прочитанной страницы, позволяет с удобством читать онлайн бесплатно книгу «Spectroscopy for Materials Characterization», без необходимости каждый раз заново искать на чём Вы остановились. Поставьте закладку, и сможете в любой момент перейти на страницу, на которой закончили чтение.
Интервал:
Закладка:
We now return to the experimental results on the (  Si─O─) 3Si─O •to complete the description with the vibrational properties of the excited electronic state. Figure 2.12shows the spectrum obtained under excitation at E exc= 2.112 eV, where no resonant luminescence appears. In contrast, a sharp line is detected at lower energies, shifted by 920 ± 3 cm −1from the excitation; the accuracy being determined by the preliminary detection of the scattered laser line shown in the same figure. This sharp line is the off‐resonance ZPL that, in agreement with Figure 2.2, is excited through the vibrational level 1 of the excited electronic state. Then, the value of 920 ± 3 cm −1is the measure of the frequency ω eof the surface Si─O •stretching in the excited electronic state that is almost coincident with that in the ground electronic state. This finding demonstrates the validity of the linear coupling between the optical transition around 2.0 eV and the localized mode. Moreover, on the basis of the reduced mass of the Si─O molecule ( m *= 1.692 × 10 −26kg), it is possible to calculate the force constant of Si─O •bond at the surface: k = ( ω surf) 2⋅ m *≈ 508 N m −1.
Inhomogeneous broadening measured by ZPL distribution:Finally, we report the study of the inhomogeneous properties of NBOHC at the surface of silica taking advantage of time‐resolved experiments being able to detect ZPL under tunable laser excitation [29]. Figure 2.13a shows a series of time‐resolved emission spectra measured at T = 10 K with the excitation energy stepwise incremented from 1.887 to 2.077 eV (minimum step 0.003 eV); each spectrum is displayed in the vicinity of the excitation energy thus evidencing the ZPL. From these spectra, we plot in Figure 2.13b the distribution of the ZPL intensity. The experimental data are best fitted by a Gaussian curve centered at 1.995 ± 0.003 eV with FWHM of 0.042 ± 0.005 eV (340 ± 40 cm −1) that represents the inhomogeneous distribution w inh( E 00) of the electronic transitions, due to the different local environment surrounding the ( Si─O─) 3Si─O •at the silica surface. Indeed, the inhomogeneity is related to the structural disorder of the silica network in the long‐ and local‐range in comparison with the SiO 4tetrahedron size. The first is intrinsic to the amorphous state, and is mainly accounted for by the statistical distribution of the Si─O─Si bond angle and the size of (Si─O) n ring structure [30, 31]. The second is due to the presence of point defects that introduce a local distortion into the surroundings, such distortion being dependent on the site [11].
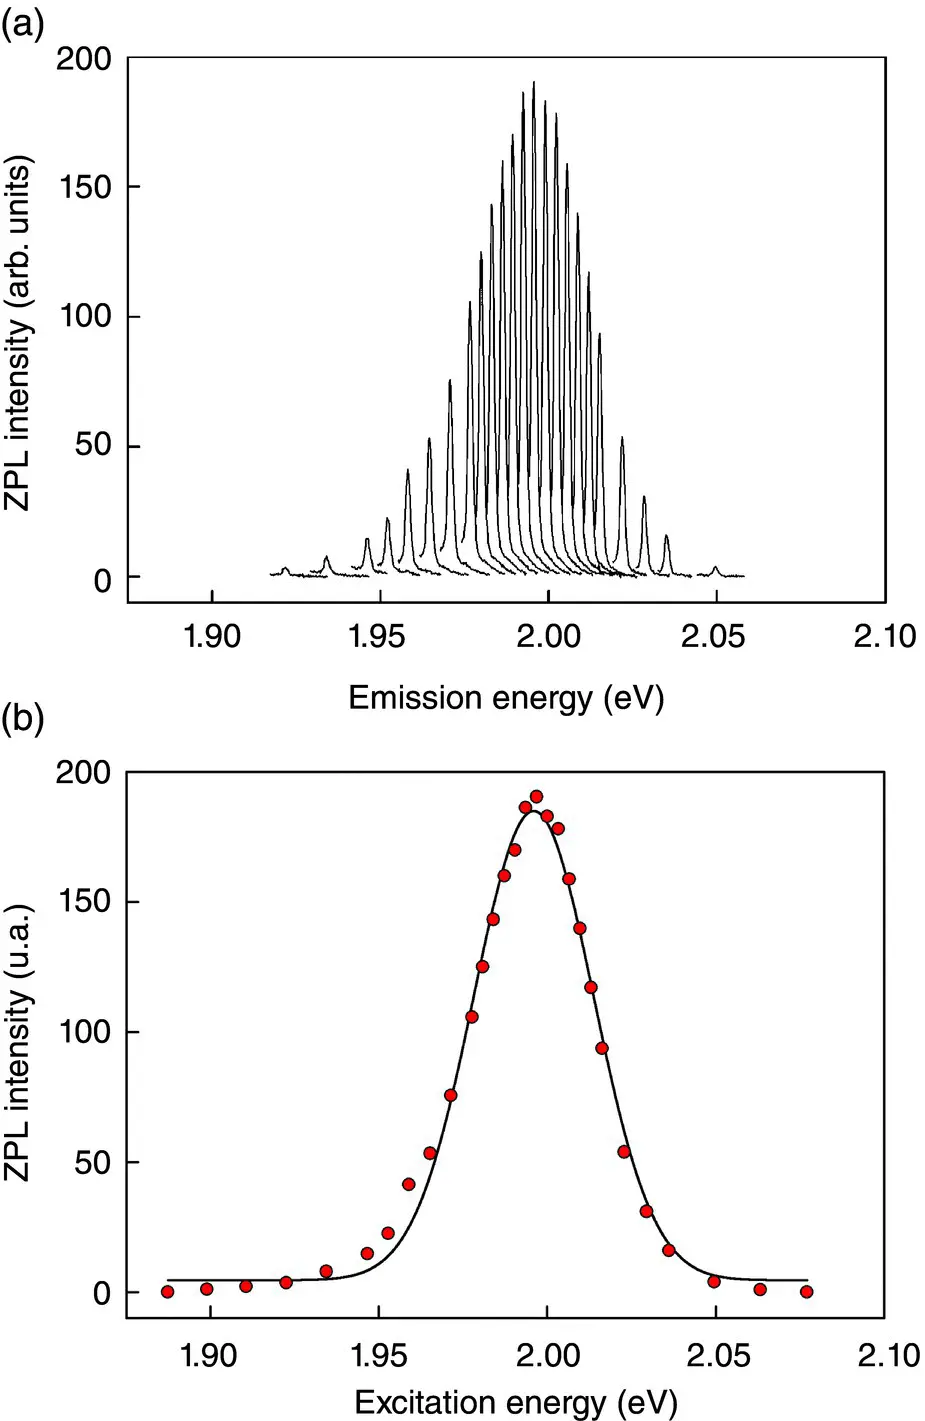
Figure 2.13Panel (a): Time‐resolved PL spectra of surface‐NBOHC ( Si─O─) 3Si─O •, measured at T = 10 K, in the ZPL region at different excitation energies from 1.89 to 2.08 eV with step 0.01, 0.006 and 0.003 eV. Panel (b): Distribution of the ZPL intensity, obtained by the spectra reported in the panel (a) (symbols), superimposed to its Gaussian best fit curve.
We observe that the main experimental outcome is the detectability of the ZPL under site‐selective excitation of inhomogeneously distributed centers, thus allowing the inhomogeneous curve to be drawn directly. The detection of the ZPL is therefore a probe of the silica structure near the NBOHC; this potential is precluded for other defects in silica, because of the stronger phonon coupling of their optical transitions. In those cases, the deconvolution between homogeneous and inhomogeneous broadening can be done only indirectly.
References
1 1 Herzberg, G. (1966). Molecular Spectra and Molecular Structure. New York: Van Nostrand Reinhold.
2 2 Rebane, K.K. (1970). Impurity Spectra of Solids. New York: Plenum Press.
3 3 Stoneham, A.M. (1975). Theory of Defects in Solids. Oxford: Clarendon Press.
4 4 Watts, R.K. (1977). Point defects in Crystals. New York: John Wiley & Sons.
5 5 Yen, W.M. and Selzer, P.M. (eds.) (1981). Laser Spectroscopy of Solids. New York: Springer‐Verlag.
6 6 Sild, O. and Haller, K. (eds.) (1988). Zero Phonon Lines and Spectral Hole Burning In Spectroscopy and Photochemistry. New York: Springer‐Verlag.
7 7 Vij, D.R. (ed.) (1998). Luminescence of Solids. New York: Plenum Press.
8 8 Franck, E.G. and Dymond, E.G. (1926). Trans. Faraday Soc. 21: 536.
9 9 Condon, E.U. (1928). Phys. Rev. 32: 858.
10 10 Cannas, M. (1998). Point defects in amorphous SiO2: optical activity in the visible, UV and vacuum‐UV spectral regions. PhD thesis, Dipartimento di Scienze Fisiche ed Astronomiche, Università di Palermo, Italy.
11 11 Skuja, L. (2000). Defects in SiO2 and Related Dielectrics: Science and Technology (eds. G. Pacchioni, L. Skuja and D.L. Griscom). USA: Kluwer Academic Publishers.
12 12 Huang, K. and Rhys, A. (1950). Proc. Roy. Soc. A204: 406.
13 13 Skuja, L., Hirano, M., Hosono, H., and Kajihara, K. (2005). Phys. Phys. Stat. Sol. (c) 2: 15.
14 14 Girard, S., Alessi, A., Richard, N. et al. (2019). Rev. Phys. 4: 100032.
15 15 Vaccaro, L., Morana, A., Radzig, V., and Cannas, M. (2011). J. Phys. Chem. C 115: 19476.
16 16 Bonacchi, S., Genovese, D., Juris, R. et al. (2011). Angew. Chem., Int. Ed. 50: 4056.
17 17 Rimola, A., Costa, D., Sodupe, M. et al. (2013). Chem. Rev. 113: 4216.
18 18 Carbonaro, C., Corpino, R., Ricci, P. et al. (2014). J. Phys. Chem. C 118: 26219.
19 19 Tarpani, L., Ruhlandt, D., Latterini, L. et al. (2016). Nano Lett. 16: 4312.
20 20 Spallino, L., Spera, M., Vaccaro, L. et al. (2014). Phys. Chem. Chem. Phys. 16: 22028.
21 21 Radzig, V.A. (2000). Defects in SiO2 and Related Dielectrics: Science and Technology. In: (eds. G. Pacchioni, L. Skuja and D.L. Griscom). USA: Kluwer Academic Publishers.
22 22 Radzig, V.A. (2001). Chem. Phys. Rep. 19: 469.
23 23 Vaccaro, L., Cannas, M., Radzig, V., and Boscaino, R. (2008). Phys. Rev. B 78: 075421.
24 24 Vaccaro, L., Cannas, M., and Radzig, V. (2008). Phys. Rev. B 78: 233408.
25 25 Vaccaro, L., Cannas, M., and Radzig, V. (2009). J. Non Cryst. Solids 355: 1020.
26 26 Suzuki, T., Skuja, L., Kajihara, K. et al. (2003). Phys. Rev. Lett. 90: 186404.
27 27 Bakos, T., Rashkeev, S.N., and Pantelides, S.T. (2004). Phys. Rev. B 70: 075203.
28 28 Giordano, L., Sushko, P.V., Pacchioni, G., and Shluger, A.L. (2007). Phys. Rev. B 75: 024109.
29 29 Vaccaro, L. and Cannas, M. (2010). J. Phys. Condens. Matter 23: 235801.
30 30 Hobbs, L.W. and Yuan, X. (2000). Defects in SiO2 and Related Dielectrics: Science and Technology (eds. G. Pacchioni, L. Skuja and D.L. Griscom). USA: Kluwer Academic Publishers.
31 31 Mauri, F., Pasquarello, A., Pfrommer, B.G. et al. (2000). Phys. Rev. B 62: R4786.
3 Ultrafast Optical Spectroscopies
Alice Sciortino and Fabrizio Messina
Department of Physics and Chemistry – Emilio Segrè, University of Palermo, Palermo, Italy
3.1 Femtosecond Spectroscopy: An Overview
Traditional steady state spectroscopies, addressed in Chapter 1of this book, are essential tools to characterize a physicochemical system through the extensive mapping of its energy landscape and transitions. However, these classical methods cannot capture the dynamical aspects driving the response of the system after an initial perturbation. These aspects can only be addressed by time‐resolved spectroscopic techniques, which are methods capable of following in time the evolution of a physicochemical system, after it has been initially brought out of equilibrium by a defined stimulus, such as photon absorption. Indeed, a thorough understanding of these dynamics , as they unravel in time, is often crucial to fully elucidate the behavior of a system of physical, chemical, or biological interest.
Читать дальшеИнтервал:
Закладка:
Похожие книги на «Spectroscopy for Materials Characterization»
Представляем Вашему вниманию похожие книги на «Spectroscopy for Materials Characterization» списком для выбора. Мы отобрали схожую по названию и смыслу литературу в надежде предоставить читателям больше вариантов отыскать новые, интересные, ещё непрочитанные произведения.


Обсуждение, отзывы о книге «Spectroscopy for Materials Characterization» и просто собственные мнения читателей. Оставьте ваши комментарии, напишите, что Вы думаете о произведении, его смысле или главных героях. Укажите что конкретно понравилось, а что нет, и почему Вы так считаете.