Spectroscopy for Materials Characterization
Здесь есть возможность читать онлайн «Spectroscopy for Materials Characterization» — ознакомительный отрывок электронной книги совершенно бесплатно, а после прочтения отрывка купить полную версию. В некоторых случаях можно слушать аудио, скачать через торрент в формате fb2 и присутствует краткое содержание. Жанр: unrecognised, на английском языке. Описание произведения, (предисловие) а так же отзывы посетителей доступны на портале библиотеки ЛибКат.

- Название:Spectroscopy for Materials Characterization
- Автор:
- Жанр:
- Год:неизвестен
- ISBN:нет данных
- Рейтинг книги:5 / 5. Голосов: 1
-
Избранное:Добавить в избранное
- Отзывы:
-
Ваша оценка:
Spectroscopy for Materials Characterization: краткое содержание, описание и аннотация
Предлагаем к чтению аннотацию, описание, краткое содержание или предисловие (зависит от того, что написал сам автор книги «Spectroscopy for Materials Characterization»). Если вы не нашли необходимую информацию о книге — напишите в комментариях, мы постараемся отыскать её.
Learn foundational and advanced spectroscopy techniques from leading researchers in physics, chemistry, surface science, and nanoscience Spectroscopy for Materials Characterization,
Simonpietro Agnello
Spectroscopy for Materials Characterization
Spectroscopy for Materials Characterization — читать онлайн ознакомительный отрывок
Ниже представлен текст книги, разбитый по страницам. Система сохранения места последней прочитанной страницы, позволяет с удобством читать онлайн бесплатно книгу «Spectroscopy for Materials Characterization», без необходимости каждый раз заново искать на чём Вы остановились. Поставьте закладку, и сможете в любой момент перейти на страницу, на которой закончили чтение.
Интервал:
Закладка:
The temperature dependence of the ratio between the intensities of ZPL and the whole band, I ZPL/ I TOT, namely the Debye–Waller factor α ( T ), is shown in Figure 2.10; it allows to quantify the thermal deactivation of the environment vibrational modes the PL transition is coupled to. Panel (a) illustrates the measure of I TOT(shaded area) and I 0L(shaded area in the inset) in the spectrum detected at T = 8 K. Panel (b) evidences that α ( T ) decreases from 0.11 to 0.005 on increasing temperature from 8 to 137 K. As reported in the previous section, the expression of α ( T ) is derived under the straightforward approximation (homogeneous system of defects characterized by an electronic transition linearly coupled to a single mode of mean effective frequency ϖ ), so that all defects are selectively excited, namely ZPL is in resonance with laser light:
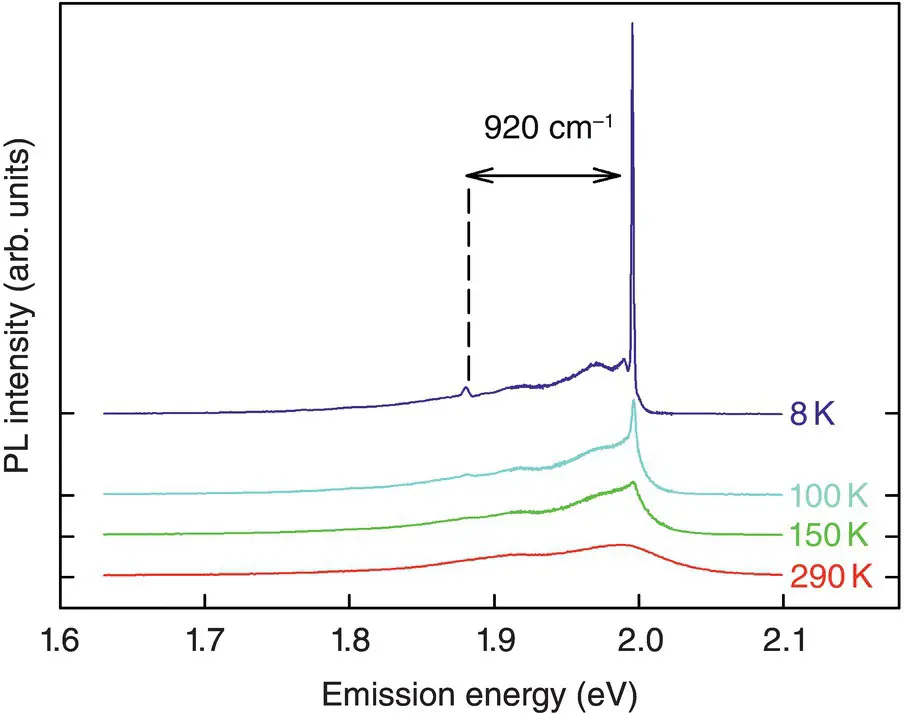
Figure 2.9Time‐resolved PL spectra of surface‐NBOHC (  Si─O─) 3Si─O •under pulsed laser excitation at E exc= 1.997 eV measured on decreasing temperature from 290K to 8 K. At lower temperature, the ZPL and the vibration 920 cm −1apart from it are clearly visible.
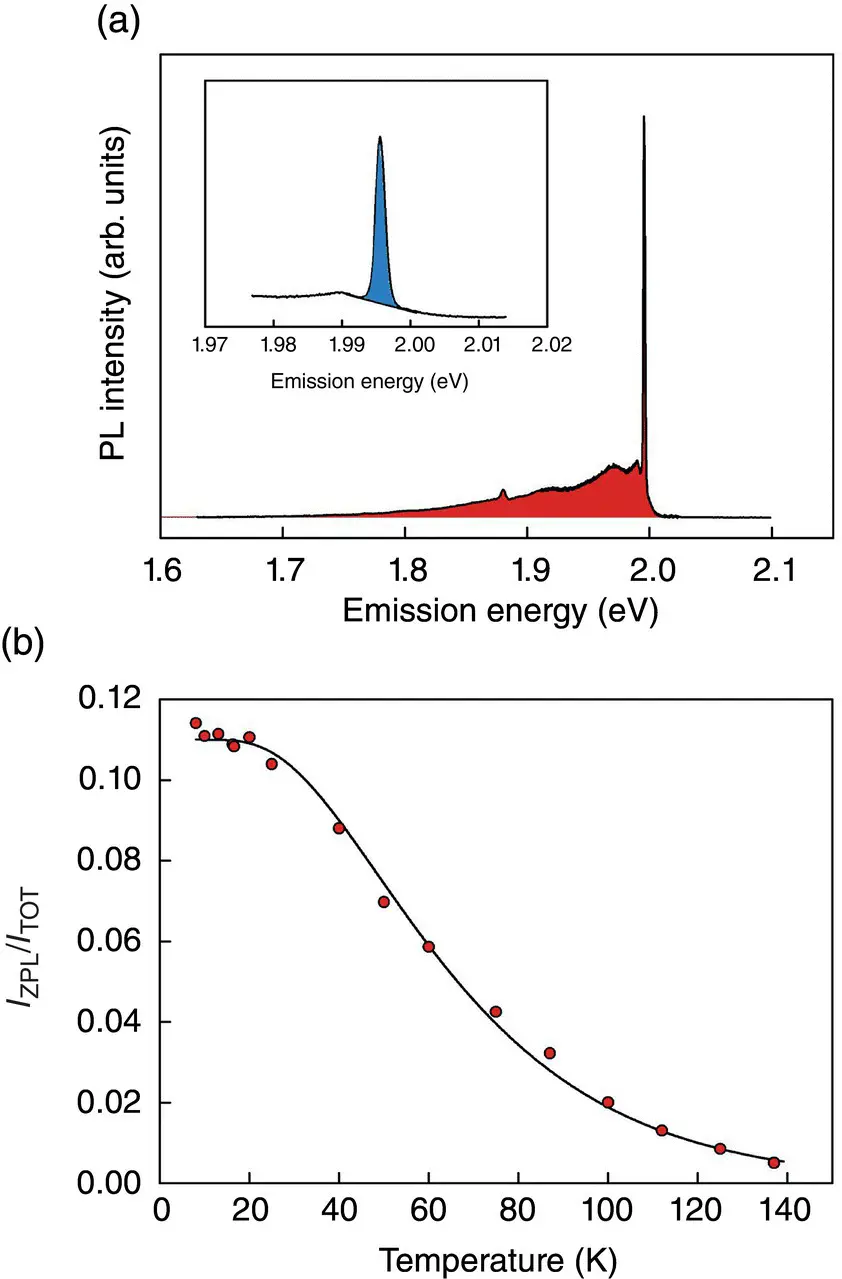
Figure 2.10Panel (a): Time‐resolved PL spectrum of surface‐NBOHC ( Si─O─) 3Si─O •under pulsed laser excitation at E exc= 1.997 eV measured at T = 8 K. The shaded area represents the total integrated intensity, I TOT, the shaded area in the inset corresponds to the integrated intensity of ZPL, I ZPL. Panel (b): Temperature dependence of the Debye–Waller factor; solid line is the best fit curve of Eq. (2.79).
(2.79) 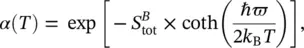
where  , the total Huang–Rhys factor, is the coupling strength averaged over the totality of phonons. Experimental results and the curve of Eq. (2.79)are in good agreement and the best‐fit parameters turn out to be:
  = 2.2 ± 0.1 and ϖ = 89 ± 7 cm −1. However, as we will demonstrate in the following, the optical lineshape of surface‐NBOHC has an inhomogeneous component. This implies that a fraction of NBOHC is not selectively excited (the ZPL is not in resonance with the laser light), so as to give a contribution to the spectrum independent of temperature; for this reason,
  = 2.2 represents an upper limit of the actual value. We also note that the calculated values lead to a Stokes shift smaller than
 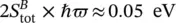 , in good agreement with the experimental results on the emission/excitation spectra of this surface‐NBOHC variant.
The most significant features of the local vibrations, coupled to the electronic transition around 2 eV, are derived by the emission spectra reported in the upper and lower side of Figure 2.11. The emission excited at 1.997 eV shows the ZPL, whose FWHM is ≈1.4 meV (11 cm −1), coincident with the laser line; that is, the ZPL originates from those centers located within the laser spectral linewidth in a much larger inhomogeneous distribution. At lower energies one observes two phonon sidebands centered at 923 ± 3 and 1840 ± 10 cm −1apart from the ZPL.
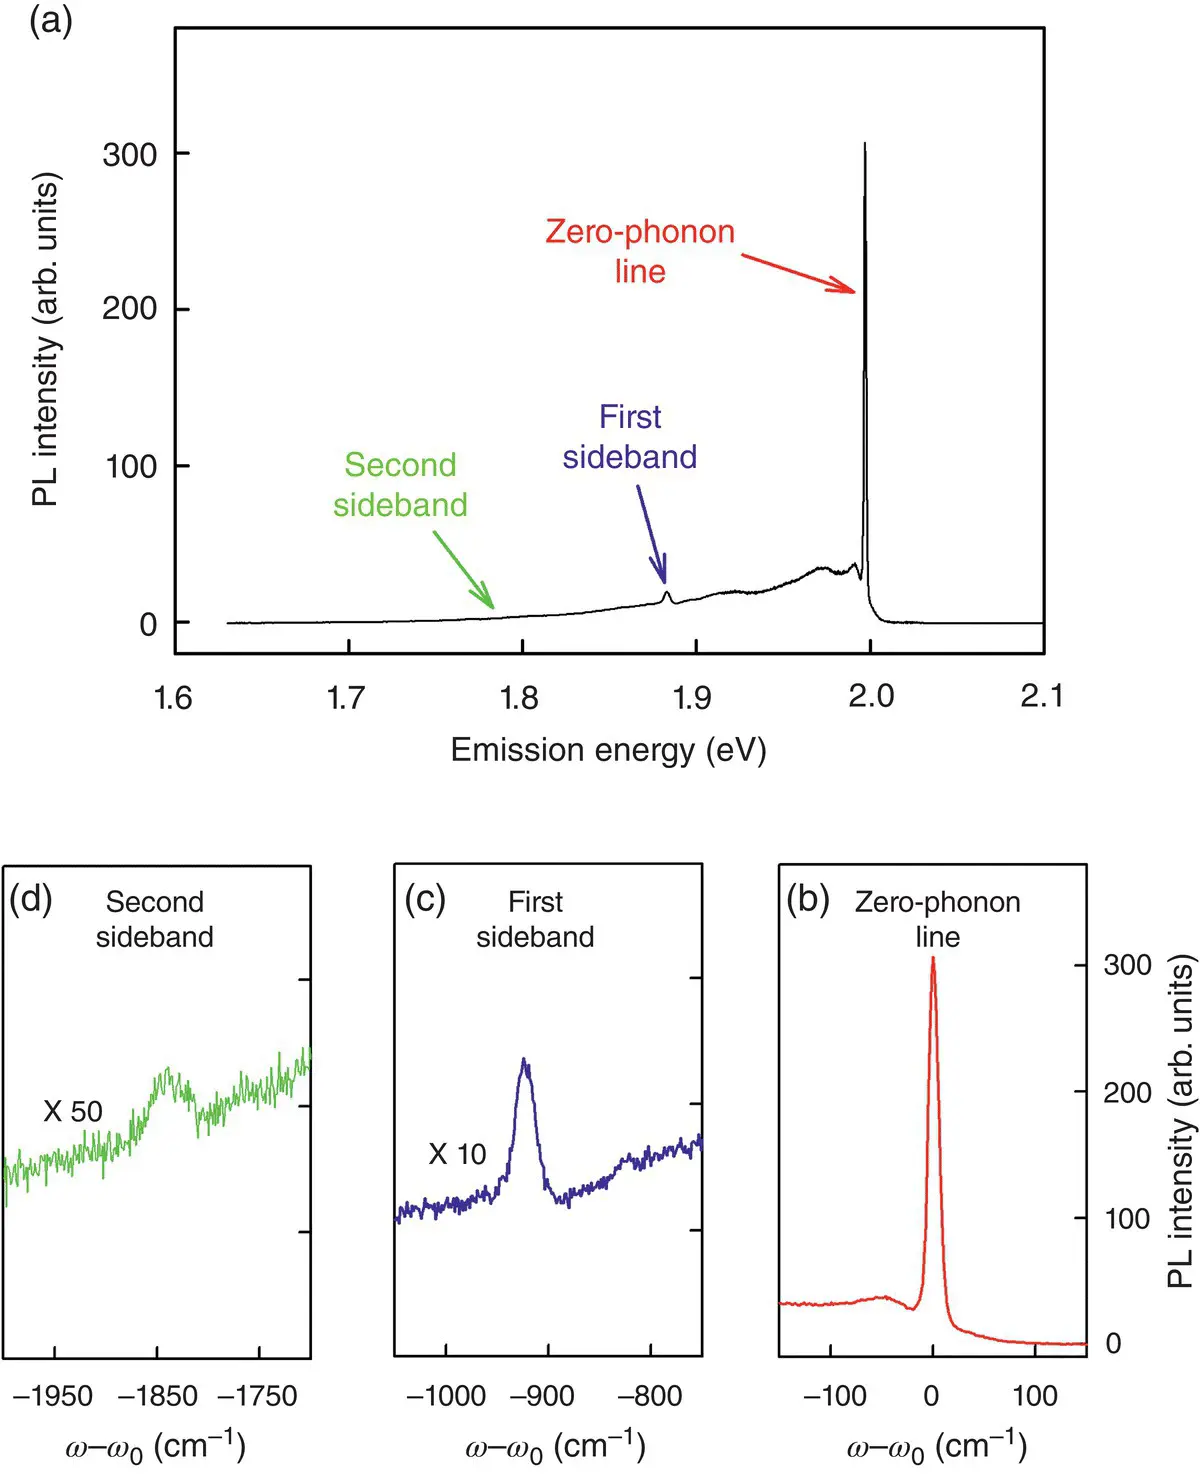
Figure 2.11Panel (a): Time‐resolved PL spectrum of surface‐NBOHC ( Si─O─) 3Si─O •measured at T = 8 K under pulsed laser excitation at E exc= ℏ ω 0= 1.997 eV. Panels (b–d): Zooms that show the ZPL profile (b), the first (c) and the second (d) sidebands plotted as a function of distance from the laser line ω 0.
In agreement with Figure 2.2, they represent the transitions from the lower vibrational level in the excited electronic state to the first and second vibrational levels in the ground electronic state, respectively. The measured values, therefore, identify the fundamental, ω g, and the overtone, 2 ω g, frequencies of the nearly equally spaced vibrational levels of the surface‐nonbridging oxygen in the electronic ground state. We note that these sidebands are more and more wider than the ZPL, their FWHM being ∼20 and 40 cm −1for the first and the second line, respectively; this spreading is due to an inhomogeneous distribution of the vibrational frequency of centers having the same ZPL. From these emission spectra, we also measure the ratio between the integrated intensities of ZPL and the first and second vibrational lines: I 0L/ I 1L= 13.5 ± 0.5, I 0L/ I 2L= 160 ± 30, the error being mainly due to the inaccuracy in the reference line subtraction to account for the overlapping with nonselectively excited luminescence. Based on the linear electron–phonon coupling, subsequently evidenced by the equal values of vibration frequency both in the ground and in the excited state, we compare these values with the Poisson’s distribution, I kL= exp(− S ) L× ( S L) k/ k ! and extract the partial Huang–Rhys factor S L: I 0L/ I 1L= 1/ S Lyields S L= 0.074 ± 0.003 and I 0L/ I 2L= 2/( S L) 2yields S L= 0.11 ± 0.01. We note that the difference between the values of S is larger than the experimental uncertainty; despite this incongruence, these results quantify the low coupling of the electronic transition with the local Si─O •stretching mode, namely, the nearly absent relaxation of the Si─O •bond after excitation.
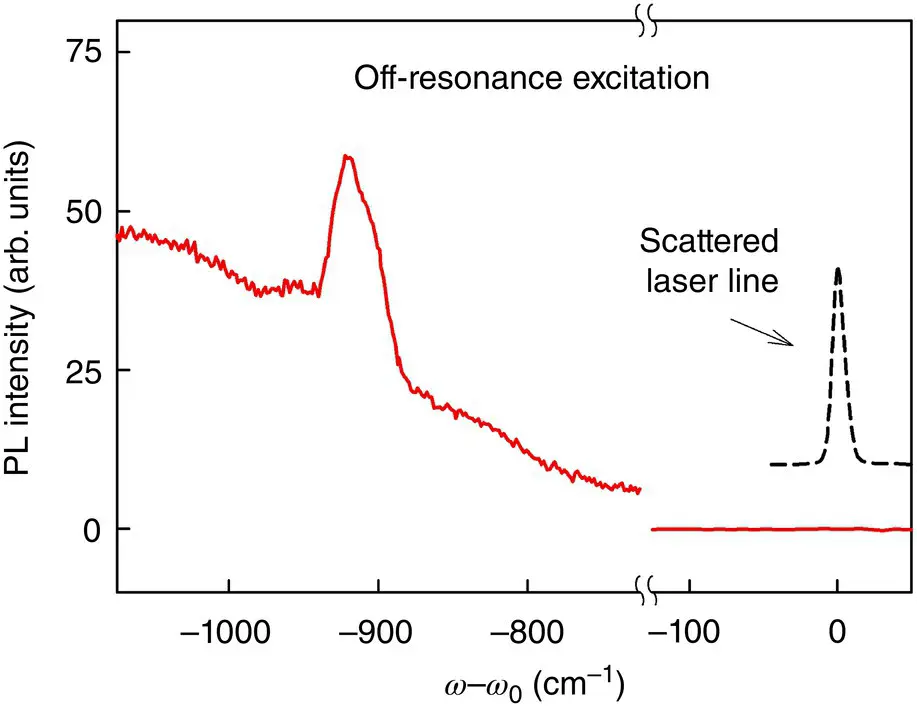
Figure 2.12Time‐resolved PL spectrum of the surface‐NBOHC ( Si─O─) 3Si─O •measured at T = 10 K under pulsed laser excitation at E exc= ℏ ω 0= 2.112 eV and plotted as a function of the distance from the laser line ω 0. The laser lineshape, acquired by the scattered light, is also shown arbitrarily scaled respect to the emission spectrum.
Интервал:
Закладка:
Похожие книги на «Spectroscopy for Materials Characterization»
Представляем Вашему вниманию похожие книги на «Spectroscopy for Materials Characterization» списком для выбора. Мы отобрали схожую по названию и смыслу литературу в надежде предоставить читателям больше вариантов отыскать новые, интересные, ещё непрочитанные произведения.


Обсуждение, отзывы о книге «Spectroscopy for Materials Characterization» и просто собственные мнения читателей. Оставьте ваши комментарии, напишите, что Вы думаете о произведении, его смысле или главных героях. Укажите что конкретно понравилось, а что нет, и почему Вы так считаете.