Spectroscopy for Materials Characterization
Здесь есть возможность читать онлайн «Spectroscopy for Materials Characterization» — ознакомительный отрывок электронной книги совершенно бесплатно, а после прочтения отрывка купить полную версию. В некоторых случаях можно слушать аудио, скачать через торрент в формате fb2 и присутствует краткое содержание. Жанр: unrecognised, на английском языке. Описание произведения, (предисловие) а так же отзывы посетителей доступны на портале библиотеки ЛибКат.

- Название:Spectroscopy for Materials Characterization
- Автор:
- Жанр:
- Год:неизвестен
- ISBN:нет данных
- Рейтинг книги:5 / 5. Голосов: 1
-
Избранное:Добавить в избранное
- Отзывы:
-
Ваша оценка:
Spectroscopy for Materials Characterization: краткое содержание, описание и аннотация
Предлагаем к чтению аннотацию, описание, краткое содержание или предисловие (зависит от того, что написал сам автор книги «Spectroscopy for Materials Characterization»). Если вы не нашли необходимую информацию о книге — напишите в комментариях, мы постараемся отыскать её.
Learn foundational and advanced spectroscopy techniques from leading researchers in physics, chemistry, surface science, and nanoscience Spectroscopy for Materials Characterization,
Simonpietro Agnello
Spectroscopy for Materials Characterization
Spectroscopy for Materials Characterization — читать онлайн ознакомительный отрывок
Ниже представлен текст книги, разбитый по страницам. Система сохранения места последней прочитанной страницы, позволяет с удобством читать онлайн бесплатно книгу «Spectroscopy for Materials Characterization», без необходимости каждый раз заново искать на чём Вы остановились. Поставьте закладку, и сможете в любой момент перейти на страницу, на которой закончили чтение.
Интервал:
Закладка:
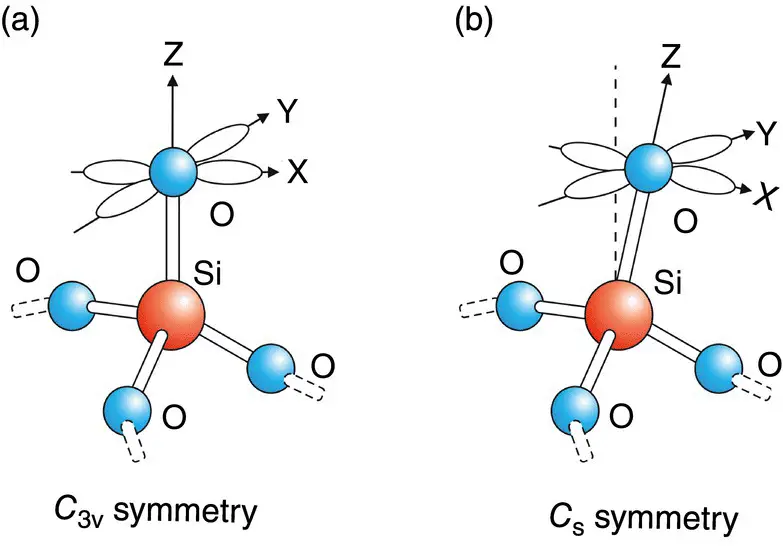
Figure 2.6Structure of the NBOHC and p orbitals of the dangling oxygen in the (panel a) C 3vand (panel b) C Ssymmetries.
2.3.1 Emission Spectra and Lifetime Measurements
Several studies have evidenced that NBOHC at the silica surface emits a luminescence band around 2.0 eV with a composite excitation profile consisting of a peak at 2.0 eV, nearly overlapping with the emission, and an UV broadband with peaks at 4.8 and 6.0 eV [23–25]. Time‐resolved spectra have been performed in agreement with the experimental setup described in the previous section.
In Figure 2.7are reported time‐resolved PL spectra acquired under pulsed laser excitation at 2.07 eV (panel a) and at 4.77 eV (panel b) with Δ t = 4 μs and T Dgoing from 1 to 248 μs, when the decay of the PL emission is almost completed.
To analyze the luminescence decay from the PL spectra reported in Figure 2.7, we have derived the decay kinetics of the two sub‐bands ( E em= 1.91 eV and E em= 1.99 eV) under visible ( E exc= 2.07 eV) and UV ( E exc= 4.77 eV) excitation ( Figure 2.8a). As evident from the semilogarithmic scale, the PL decay curves deviate from a single exponential law. This behavior is common to color centers embedded in amorphous network and is consistent with a multiexponential curve with decay constants inhomogeneously distributed. The quantitative analysis of the PL time decay, I(t) , has been carried out by a stretched exponential decay function :
(2.78) 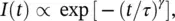
where τ is the lifetime and γ ≤1 is a stretching parameter that measures the deviation from a single exponential decay. The results obtained from the fitting procedure are reported in Table 2.1.
To complete the lifetime study, in Figure 2.8b we show the temperature dependence of the decay kinetics of the PL band excited at E exc= 4.77 eV. Since the two sub‐bands have similar properties, we only display the curve related to one of them ( E em= 1.99 eV). The deviation from a single exponential law is maintained in the investigated temperature range and the lifetime slightly increases from τ = 41.2 ± 0.5 μs, at T = 300 K, to τ = 52.0 ± 0.5 μs, at T = 10 K. Combining the luminescence lifetime at low temperature ( τ ≈50 μs) and the Einstein coefficient relation ( Eq. 2.66), it is possible to estimate the oscillator strength of the 2.0 eV absorption band for the surface‐NBOHC: f ≈ 6 × 10 −5.

Figure 2.7Time‐resolved PL spectra acquired at different delays in the sample containing (  Si─O─) 3Si─O •surface‐defects under laser excitation at 2.07 eV (panel a) and 4.77 eV (panel b).
We observe that the spectral features of surface‐NBOHC can be accounted for by an energy‐level scheme, where two different pathways of excitation/emission can be distinguished. The first includes the cycle 2.0 eV (excitation)/1.9 eV (emission) occurring between two electronic states, whose small Stokes shift is consistent with a very weak electron–phonon coupling. The second cycle, UV and vacuum UV (excitation)/1.9 eV (emission), involves additional electronic states and the large Stokes shift is due to non‐radiative electronic relaxations. The excited state from which the PL takes place is commonly associated with a lone pair in both nonbonding 2p orbitals of the dangling oxygen [26–28]. In contrast, conflicting models have been put forward to account for the states originating the excitation bands; one of the most accepted hypotheses that the 2.0 eV band is associated with the charge transfer from the Si─O •bonding orbital to one of the nonbonding orbitals, while in the UV and vacuum‐UV bands, the charge transfer originates from the nonbonding 2p orbitals of the basal oxygen [21, 26, 28]. In this framework, the time‐resolved experiments help in the interpretation since the long lifetime ( τ ≈50 μs) points out the forbidden character of the PL transition due to the small overlap between the filled 2p orbitals of the nonbridging oxygen atom, which identify the excited state, and that where the charge transfer terminates.
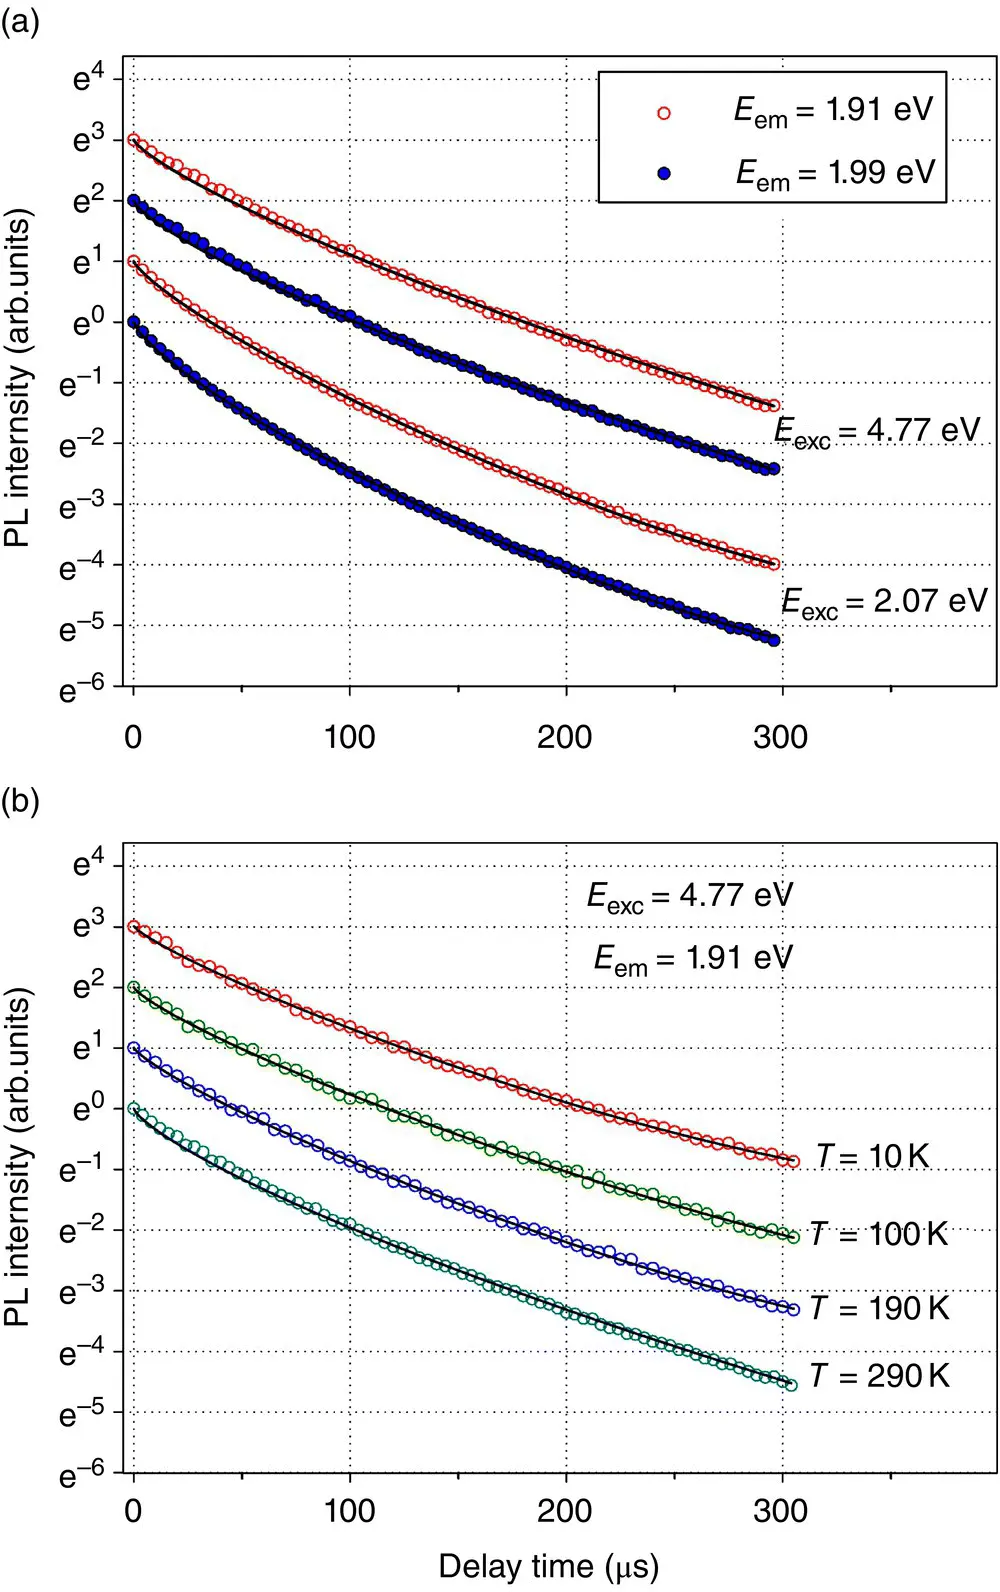
Figure 2.8Panel (a): Semilog plots of the PL decay in surface‐NBOHC ( S─i─O─) 3Si─O •detected at room temperature at E em= 1.91 and 1.99 eV under laser excitation at E exc= 4.77 and 2.07 eV. Panel (b): Semilog plots of the PL decay in surface‐NBOHC ( Si─O─) 3Si─O •detected at different temperatures at E em= 1.91 eV under E exc= 4.77 eV. For viewing purposes, the initial values of the decay curves are arbitrarily scaled. Full lines plot the best fit curves of Eq. (2.78).
Table 2.1Best‐fitting parameters obtained by Eq. (2.78)for the decay kinetics of the two PL sub‐bands measured in the sample containing the surface‐NBOHC ( Si─O─) 3Si─O •.
| E exc(eV) | E em(eV) | τ (μs) | γ |
|---|---|---|---|
| 2.07 | 1.92 | 35.2 ± 0.5 | 0.79 ± 0.02 |
| 1.99 | 29.9 ± 0.5 | 0.75 ± 0.02 | |
| 4.77 | 1.92 | 44.3 ± 0.5 | 0.78 ± 0.02 |
| 1.99 | 41.2 ± 0.5 | 0.76 ± 0.02 |
1
The associated errors derive from the best‐fitting procedures.
2.3.2 Zero‐Phonon Line Probed by Site‐Selective Luminescence
The results reported in the previous section have evidenced that surface‐NBOHC (≡Si – O–) 3Si – O •is characterized by a small Stokes shift between its excitation and emission transitions peaked around 2 eV. This implies the possibility to detect, under site‐selective excitation, the ZPL and the vibrational structures with which the electronic transition is coupled. The main purposes of this study are: (i) the measure of the stretching frequency of the Si─O •bond in the ground and in the excited electronic state; (ii) the measure of the phonon coupling parameters; (iii) the measure of the inhomogeneous distribution of the ZPL.
Vibrational properties: Figure 2.9shows the effects of temperature on time‐resolved PL spectra measured with E exc= 1.997 eV. At T = 290 K, the emission is characterized by two sub‐bands peaked at 1.92 ± 0.01 and 1.99 ± 0.01 eV, and it extends over the anti‐Stokes region. On lowering temperature, the PL amplitude increases, the anti‐Stokes part vanishes and, below 150 K, the ZPL resonant with the excitation is increasingly evident together with a vibrational structure at 920 cm −1apart from it. The origin of the 920 cm −1line will be clarified in the following.
Читать дальшеИнтервал:
Закладка:
Похожие книги на «Spectroscopy for Materials Characterization»
Представляем Вашему вниманию похожие книги на «Spectroscopy for Materials Characterization» списком для выбора. Мы отобрали схожую по названию и смыслу литературу в надежде предоставить читателям больше вариантов отыскать новые, интересные, ещё непрочитанные произведения.


Обсуждение, отзывы о книге «Spectroscopy for Materials Characterization» и просто собственные мнения читателей. Оставьте ваши комментарии, напишите, что Вы думаете о произведении, его смысле или главных героях. Укажите что конкретно понравилось, а что нет, и почему Вы так считаете.