James W. Brown - Principles of Microbial Diversity
Здесь есть возможность читать онлайн «James W. Brown - Principles of Microbial Diversity» — ознакомительный отрывок электронной книги совершенно бесплатно, а после прочтения отрывка купить полную версию. В некоторых случаях можно слушать аудио, скачать через торрент в формате fb2 и присутствует краткое содержание. Жанр: unrecognised, на английском языке. Описание произведения, (предисловие) а так же отзывы посетителей доступны на портале библиотеки ЛибКат.
- Название:Principles of Microbial Diversity
- Автор:
- Жанр:
- Год:неизвестен
- ISBN:нет данных
- Рейтинг книги:5 / 5. Голосов: 1
-
Избранное:Добавить в избранное
- Отзывы:
-
Ваша оценка:
Principles of Microbial Diversity: краткое содержание, описание и аннотация
Предлагаем к чтению аннотацию, описание, краткое содержание или предисловие (зависит от того, что написал сам автор книги «Principles of Microbial Diversity»). Если вы не нашли необходимую информацию о книге — напишите в комментариях, мы постараемся отыскать её.
provides a solid curriculum for students to explore the enormous range of biological diversity in the microbial world. Within these richly illustrated pages, author and professor James W. Brown provides a practical guide to microbial diversity from a phylogenetic perspective in which students learn to construct and interpret evolutionary trees from DNA sequences. He then offers a survey of the «tree of life» that establishes the necessary basic knowledge about the microbial world. Finally, the author draws the student's attention to the universe of microbial diversity with focused studies of the contributions that specific organisms make to the ecosystem.
Principles of Microbial Diversity
Principles of Microbial Diversity — читать онлайн ознакомительный отрывок
Ниже представлен текст книги, разбитый по страницам. Система сохранения места последней прочитанной страницы, позволяет с удобством читать онлайн бесплатно книгу «Principles of Microbial Diversity», без необходимости каждый раз заново искать на чём Вы остановились. Поставьте закладку, и сможете в любой момент перейти на страницу, на которой закончили чтение.
Интервал:
Закладка:
So, if a tree just fundamentally does not look right, check the alignment first and then the quality of the sequences, but then think about the sequences used and how a tree of these sequences might not reflect the relationships between the organisms.
PROBLEMS
1 1. Construct a similarity matrix from this alignment:
2 2. Given the Jukes and Cantor conversion graph in Fig. 4.1, convert the similarity matrix from question 1 to a distance matrix.
3 3. Given this distance matrix, draw a tree relating these sequences and label the lengths of the branches of the tree:
4 4. Given this distance matrix, draw the structure of a tree relating the sequences using the neighbor-joining method, and label the lengths of the branches:
5 5. Generate a tree from this alignment using the neighbor-joining method, with approximate branch lengths.
How to read a phylogenetic tree
A phylogenetic tree is a representation of the evolutionary/genealogical relationships among a collection of organisms (or molecular sequences). There are many different ways to draw these trees, but they share a common set of features: terminal nodes, branches connected by internal nodes, perhaps a root, and a scale (Fig. 4.2).

Figure 4.2An example phylogenetic tree of the relationships between great apes. doi:10.1128/9781555818517.ch4.f4.2
Scale
The scale typically is either time or evolutionary distance. Trees with a time scale are based on some form of physical data, such as a fossil record, that provide dating information. If the scale is time, all modern organisms should obviously be shown at the same part of the scale (the present). More often, the scale is evolutionary distance, i.e., some measure of change in the organisms (or molecules). Because the extent of divergence is usually different in various parts of the tree, this is depicted by the lengths of the branches and a scale bar.
Terminal nodes
Terminal nodes are the ends of the branches of the evolutionary tree; typically these are the modern organisms (or molecules) being compared, but in some cases they are the ends of evolutionary branches that became extinct or provided museum samples.
Internal nodes
Internal nodes represent the last common ancestors of all of the organisms (or molecules) bound by this node.
Root
The root is the “base” of the tree—the last common ancestor of all of the organisms (or molecules) in the tree. It is not always possible to identify the root of a tree; typically, this requires either physical data (e.g., a fossil record) or data about organisms outside the part of the tree shown, i.e., an outgroup.
Branches
Branches are the connections between nodes in the tree. They represent the evolutionary pathways between common ancestors (internal nodes) and modern organisms (terminal nodes). The lengths of these branches are defined by the scale; each branch represents a certain length of historical time if time is the scale used in the tree, or a certain amount of evolutionary change if evolutionary distance is the scale used in the tree.
Tree representations
There are a variety of ways of drawing the same tree. Figure 4.3 shows two trees of the same organisms. The scales (time) in these two trees are horizontal rather than vertical, and the branches are simple diagonal lines connecting nodes, but the information in these trees is the same as in Fig. 4.2. These trees are phenograms; the scale is read from an axis, in this case the horizontal axis. Also notice that the order of the terminal nodes is irrelevant: only the topology of the tree and the lengths of the connections count. The positions of the branches and nodes can be switched around at will as long as the nodes and their connections are not broken and remain true to the scale.
Figure 4.4 shows trees in which the scale, in this case phylogenetic distance (the extent of divergence of some sequence), is measured along the lengths of the branches. Notice that the lengths of the branches are uneven, because the rates of evolutionary change in these sequences are not constant. The tree on the right is rootless; no root is shown. In order to root a tree (as in the tree to the left), data from the fossil record or other physical information is needed, or in a molecularly based tree, an outgroup must be included in the tree to place the root. For example, in this tree of apes, the tree could be rooted with data from an Old World monkey.
These trees are dendrograms; the scale is measured along the branch lengths rather than horizontally or vertically (Fig. 4.5). The evolutionary distance between any two organisms is the total of the lengths of all of the branches that connect them. For example, the evolutionary distance between lowland gorillas and lowland chimps would be about 0.0143.
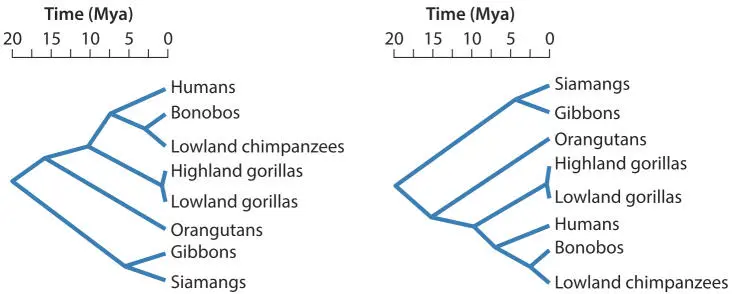
Figure 4.3Two different representations of the same phenogram of phylogenetic relationships among great apes. doi:10.1128/9781555818517.ch4.f4.3

Figure 4.4Two different dendrogram representations of the same phylogenetic relationships. doi:10.1128/9781555818517.ch4.f4.4

Figure 4.5Measuring phylogenetic distances in dendrograms. doi:10.1128/9781555818517.ch4.f4.5
A phenogram can also be used with an evolutionary distance scale. In this case, remember that the scale (evolutionary distance) is measured only in horizontal (or vertical) distance (Fig. 4.6).
Because evolutionary rates are not constant, some organisms have changed more than others since their common ancestor. In the example above, the sequences of humans have changed more than those of lowland chimps since their last common ancestor. Lowland chimps, then, are primitive relative to humans with respect to this sequence. Humans are more highly derived than chimps, again with respect to this sequence. If the traits of an organism overall are more similar to the ancestor than in the other members of that group, that organism is thought of as a primitive organism. This is very useful information, but it can be dangerous—in most cases, the traits of an organism are not evolving at similar or constant rates, and so an organism might be primitive in most traits but highly derived in others. Sharks, for example, are primitive fish with respect to many traits (e.g., cartilaginous skeletons and placoid scales) but are highly derived with respect to others (immunologically, and their electrosensory system). The danger is a tendency to confuse generally primitive organisms with ancestors. For example, chimps are morphologically more primitive than humans, but chimps are not ancestors of humans; the common ancestor of humans and chimps was not a chimp. Chimps are modern organisms! They just have more morphological similarity to the common ancestor of humans and chimps than do humans.
Читать дальшеИнтервал:
Закладка:
Похожие книги на «Principles of Microbial Diversity»
Представляем Вашему вниманию похожие книги на «Principles of Microbial Diversity» списком для выбора. Мы отобрали схожую по названию и смыслу литературу в надежде предоставить читателям больше вариантов отыскать новые, интересные, ещё непрочитанные произведения.


Обсуждение, отзывы о книге «Principles of Microbial Diversity» и просто собственные мнения читателей. Оставьте ваши комментарии, напишите, что Вы думаете о произведении, его смысле или главных героях. Укажите что конкретно понравилось, а что нет, и почему Вы так считаете.