Encyclopedia of Glass Science, Technology, History, and Culture
Здесь есть возможность читать онлайн «Encyclopedia of Glass Science, Technology, History, and Culture» — ознакомительный отрывок электронной книги совершенно бесплатно, а после прочтения отрывка купить полную версию. В некоторых случаях можно слушать аудио, скачать через торрент в формате fb2 и присутствует краткое содержание. Жанр: unrecognised, на английском языке. Описание произведения, (предисловие) а так же отзывы посетителей доступны на портале библиотеки ЛибКат.
- Название:Encyclopedia of Glass Science, Technology, History, and Culture
- Автор:
- Жанр:
- Год:неизвестен
- ISBN:нет данных
- Рейтинг книги:3 / 5. Голосов: 1
-
Избранное:Добавить в избранное
- Отзывы:
-
Ваша оценка:
Encyclopedia of Glass Science, Technology, History, and Culture: краткое содержание, описание и аннотация
Предлагаем к чтению аннотацию, описание, краткое содержание или предисловие (зависит от того, что написал сам автор книги «Encyclopedia of Glass Science, Technology, History, and Culture»). Если вы не нашли необходимую информацию о книге — напишите в комментариях, мы постараемся отыскать её.
The
has been designed to satisfy the needs and curiosity of a broad audience interested in the most varied aspects of material that is as old as the universe. As described in over 100 chapters and illustrated with 1100 figures, the practical importance of glass has increased over the ages since it was first man-made four millennia ago. The old-age glass vessels and window and stained glass now coexist with new high-tech products that include for example optical fibers, thin films, metallic, bioactive and hybrid organic-inorganic glasses, amorphous ices or all-solid-state batteries.
In the form of scholarly introductions, the Encyclopedia chapters have been written by 151 noted experts working in 23 countries. They present at a consistent level and in a self-consistent manner these industrial, technological, scientific, historical and cultural aspects. Addressing the most recent fundamental advances in glass science and technology, as well as rapidly developing topics such as extra-terrestrial or biogenic glasses, this important guide:
Begins with industrial glassmaking Turns to glass structure and to physical, transport and chemical properties Deals with interactions with light, inorganic glass families and organically related glasses Considers a variety of environmental and energy issues And concludes with a long section on the history of glass as a material from Prehistory to modern glass science The
has been written not only for glass scientists and engineers in academia and industry, but also for material scientists as well as for art and industry historians. It represents a must-have, comprehensive guide to the myriad aspects this truly outstanding state of matter.
Encyclopedia of Glass Science, Technology, History, and Culture — читать онлайн ознакомительный отрывок
Ниже представлен текст книги, разбитый по страницам. Система сохранения места последней прочитанной страницы, позволяет с удобством читать онлайн бесплатно книгу «Encyclopedia of Glass Science, Technology, History, and Culture», без необходимости каждый раз заново искать на чём Вы остановились. Поставьте закладку, и сможете в любой момент перейти на страницу, на которой закончили чтение.
Интервал:
Закладка:
As indicated by its name, the CPT treats the glass transition as a percolation‐type second‐order transformation [27]. It pictures it as the disappearance in the glassy state of percolating clusters of broken bonds – configurons. Above T g, percolating clusters, which are formed by broken bonds, enable a floppier structure and hence a greater degree of freedom for atomic motion so that it results in a higher heat capacity and thermal expansion coefficient. Below T gthere are no extended clusters of broken bonds such that the material has acquired a 3‐D structure with a bonding system similar to that of crystals except for lattice disorder. This disordered lattice then contains only point defects in the form of configurons. Agglomerates of fractal structures made of these broken bonds are present only above T g, which is given by:
( 10) 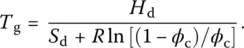
In this equation H dand S dare the quasi‐equilibrium (isostructural) enthalpy and entropy of configurons present in Eq. (7)and ϕ cis the percolation threshold, i.e. the critical fraction of space occupied by spheres of bond‐length diameters located within the bonding sites of the disordered lattice.
For strong melts such as SiO 2, the percolation threshold in Eq. (10)is given by the theoretical (universal) Scher–Zallen critical density ϕ cof 0.15 ± 0.01, which results in a practical coincidence between the calculated and measured T gvalues. The parameter H mhas no influence on T gas it characterizes the mobility of atoms or molecules through the high‐temperature fluidity of the melt – see Eq. (7). Because H dis half of bond strength ( Table 2), Eq. (10)shows that the higher this strength, the higher T g. The vacancy model of the generalized lattice theory of associated solutions provides direct means to calculate thermodynamic properties as well as the relative number of bonds formed in glasses and melts when the second coordination sphere of atoms is taken into consideration [28].
In terms of chemical bonds, an amorphous material transforms to a glass on cooling when the topology of connections changes ( Table 3), i.e. when the Hausdorff dimensionality of broken bonds changes from the 2.5 value of a fractal percolating cluster made of broken bonds to the zero value of a 3‐D solid. In terms of bonding lattice, the transition from the glass to the liquid upon heating may be explained as a reduction of the topological signature (i.e. Hausdorff dimensionality [29]) of the disordered bonding lattice from 3 for a glass (3‐D bonded material) to the fractal D fof 2.4–2.8 of the melt. These are the main changes that account for the drastic variations in material properties at glass‐to‐liquid transition [27].
Table 2 Classification of cations according to Diezel's field strength.
| Element | Valence Z | Ionic distance for oxides, Å | Coordination number | Field strength, 1/Å 2 | Bond strength, kJ/mol | Function |
|---|---|---|---|---|---|---|
| Si | 4 | 1.60 | 4 | 1.57 | 443 | Network formers: F ~1.5–2.0 |
| B | 3 | 1.50 | 3 | 1.63 | 498 | |
| 4 | 4 | 1.34 | 372 | |||
| P | 5 | 1.55 | 4 | 2.1 | 368–464 | |
| Ti | 4 | 1.96 | 4 | 1.25 | 455 | Intermediates: F ~0.5–1.0 |
| 4 | 1.96 | 6 | 1.04 | 304 | ||
| Al | 3 | 1.77 | 4 | 0.96 | 335–423 | |
| 3 | 1.89 | 6 | 0.84 | 224–284 | ||
| Fe | 3 | 1.88 | 4 | 0.85 | ||
| 3 | 1.99 | 6 | 0.76 | |||
| Be | 2 | 1.53 | 4 | 0.86 | 263 | |
| Zr | 4 | 6 | 0.84 | 338 | ||
| 4 | 2.28 | 8 | 0.77 | 255 | ||
| Mg | 2 | 2.03 | 4 | 0.53 | ||
| 2 | 2.10 | 6 | 0.45 | 155 | Network modifiers: F ~0.1–0.4 | |
| Pb | 2 | 6 | 0.34 | 310 | ||
| 2 | 2.74 | 8 | 0.27 | 151 | ||
| Ca | 2 | 2.48 | 8 | 0.33 | 134 | |
| Sr | 2 | 2.69 | 8 | 0.28 | 134 | |
| Li | 1 | 2.10 | 6 | 0.23 | 151 | |
| Na | 1 | 2.30 | 6 | 0.19 | 84 | |
| K | 1 | 2.77 | 8 | 0.13 | 54 | |
| Cs | 1 | 12 | 0.10 | 42 |
Table 3 Hausdorff dimensionality of the bonding system at glass transition.
| Amorphous material | Below T g(glasses) | Above T g(supercooled melts) |
|---|---|---|
| Broken bonds – configurons | 0 | 2.5 a |
| Chemical bonds backbone cluster | 3 | 3 |
| Chemical bonds | 3 | 2.5 a |
aExperimental dimensionality – 2.4–2.8.
Most experimental T gdata have been obtained by differential thermal analysis (DTA), differential scanning calorimetry (DSC), or dilatometry [30], where T gis generally defined as the temperature at which the tangents to the glass and liquid curves of the relevant property intersect ( Chapter 3.2). Heating (cooling) rates for DTA/DSC measurements are typically as high as 10 K/min whereas they are in 3–5 K/min range in dilatometry. As already stated, the glass transition is not abrupt but typically occurs over a few tens of degrees. For not very high cooling rates ( q ), its dependence on q is given by the Bartenev–Ritland equation:
( 11) 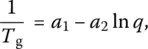
where a 1and a 2are empirical constants. Although Eq. (11)also results from CPT, it should be replaced by a generalized version at high cooling rates [31]. In addition, CPT predicts that the transition takes place not as a sharp discontinuity, but over a finite temperature interval where the properties of the material depend on time as well as on thermal history.
Following the analysis of [8], we may ask why viscous liquids eventually vitrify instead of remaining in the supercooled liquid state when they escape crystallization. One answer to this question is purely kinetic and relies only on increasingly long relaxation times or increasing viscosities on cooling. The glass transition would result only from the limited timescale of feasible measurements so that any glass would eventually relax to the equilibrium state if experiments could last forever. In fact, a simple thermodynamic argument proposed by Kauzmann [32] indicates that this answer is incorrect. The reason originates in the existence of a configurational contribution that causes the heat capacity of a liquid to be generally higher than that of a crystal of the same composition. As a consequence, the entropy of the liquid decreases on cooling faster than that of the crystal ( Figure 4).
If the entropy of the supercooled liquid were extrapolated to temperatures much below T g, it would become lower at a temperature T Kthan that of the crystal. Because it is unlikely that an amorphous phase could ever have a lower entropy than an isochemical crystal, the conclusion known as Kauzmann's paradox is that an amorphous phase cannot exist below T K. The temperature of such an entropy catastrophe constitutes the lower bound to the metastability limit of the supercooled liquid. As internal equilibrium cannot be reached below T K , the liquid must undergo a phase transition before reaching this temperature. This is, of course, the glass transition, and Kauzmann's paradox suggests that, although it is kinetic in nature, it anticipates a thermodynamic transition. In other words, CPT treats the glass transition as a true phase transformation although as a nonequilibrium one. The liquid transforms in a continuous way into a glass, which behaves mechanically as a crystalline solid when the motions of atoms become very much frustrated below T gwhere the extensive clusters of broken bonds of the liquid are no longer present. The degree of frustration then is actually the same as in a 3‐D crystalline material so that the heat capacity does not show the same high rate of change as in the liquid. This feature is clearly seen both in experiments and as an outcome of the CPT concept ( Figure 5). Importantly, CPT yields a universal law for susceptibilities such as heat capacity or thermal expansion near T g[3, 27]:
Читать дальшеИнтервал:
Закладка:
Похожие книги на «Encyclopedia of Glass Science, Technology, History, and Culture»
Представляем Вашему вниманию похожие книги на «Encyclopedia of Glass Science, Technology, History, and Culture» списком для выбора. Мы отобрали схожую по названию и смыслу литературу в надежде предоставить читателям больше вариантов отыскать новые, интересные, ещё непрочитанные произведения.


Обсуждение, отзывы о книге «Encyclopedia of Glass Science, Technology, History, and Culture» и просто собственные мнения читателей. Оставьте ваши комментарии, напишите, что Вы думаете о произведении, его смысле или главных героях. Укажите что конкретно понравилось, а что нет, и почему Вы так считаете.