Encyclopedia of Glass Science, Technology, History, and Culture
Здесь есть возможность читать онлайн «Encyclopedia of Glass Science, Technology, History, and Culture» — ознакомительный отрывок электронной книги совершенно бесплатно, а после прочтения отрывка купить полную версию. В некоторых случаях можно слушать аудио, скачать через торрент в формате fb2 и присутствует краткое содержание. Жанр: unrecognised, на английском языке. Описание произведения, (предисловие) а так же отзывы посетителей доступны на портале библиотеки ЛибКат.
- Название:Encyclopedia of Glass Science, Technology, History, and Culture
- Автор:
- Жанр:
- Год:неизвестен
- ISBN:нет данных
- Рейтинг книги:3 / 5. Голосов: 1
-
Избранное:Добавить в избранное
- Отзывы:
-
Ваша оценка:
Encyclopedia of Glass Science, Technology, History, and Culture: краткое содержание, описание и аннотация
Предлагаем к чтению аннотацию, описание, краткое содержание или предисловие (зависит от того, что написал сам автор книги «Encyclopedia of Glass Science, Technology, History, and Culture»). Если вы не нашли необходимую информацию о книге — напишите в комментариях, мы постараемся отыскать её.
The
has been designed to satisfy the needs and curiosity of a broad audience interested in the most varied aspects of material that is as old as the universe. As described in over 100 chapters and illustrated with 1100 figures, the practical importance of glass has increased over the ages since it was first man-made four millennia ago. The old-age glass vessels and window and stained glass now coexist with new high-tech products that include for example optical fibers, thin films, metallic, bioactive and hybrid organic-inorganic glasses, amorphous ices or all-solid-state batteries.
In the form of scholarly introductions, the Encyclopedia chapters have been written by 151 noted experts working in 23 countries. They present at a consistent level and in a self-consistent manner these industrial, technological, scientific, historical and cultural aspects. Addressing the most recent fundamental advances in glass science and technology, as well as rapidly developing topics such as extra-terrestrial or biogenic glasses, this important guide:
Begins with industrial glassmaking Turns to glass structure and to physical, transport and chemical properties Deals with interactions with light, inorganic glass families and organically related glasses Considers a variety of environmental and energy issues And concludes with a long section on the history of glass as a material from Prehistory to modern glass science The
has been written not only for glass scientists and engineers in academia and industry, but also for material scientists as well as for art and industry historians. It represents a must-have, comprehensive guide to the myriad aspects this truly outstanding state of matter.
Encyclopedia of Glass Science, Technology, History, and Culture — читать онлайн ознакомительный отрывок
Ниже представлен текст книги, разбитый по страницам. Система сохранения места последней прочитанной страницы, позволяет с удобством читать онлайн бесплатно книгу «Encyclopedia of Glass Science, Technology, History, and Culture», без необходимости каждый раз заново искать на чём Вы остановились. Поставьте закладку, и сможете в любой момент перейти на страницу, на которой закончили чтение.
Интервал:
Закладка:
where f is the interface site factor, D cthe kinetic (diffusion) coefficient, V mthe molar volume, and Δ G vthe difference in Gibbs free energy between unit volumes of the crystal and liquid.
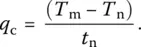
One then obtains the critical cooling time ( t c) and rate ( q c), for a defined volume fraction of crystals v c. Taking the aforementioned value v cof 1 ppm, one obtains
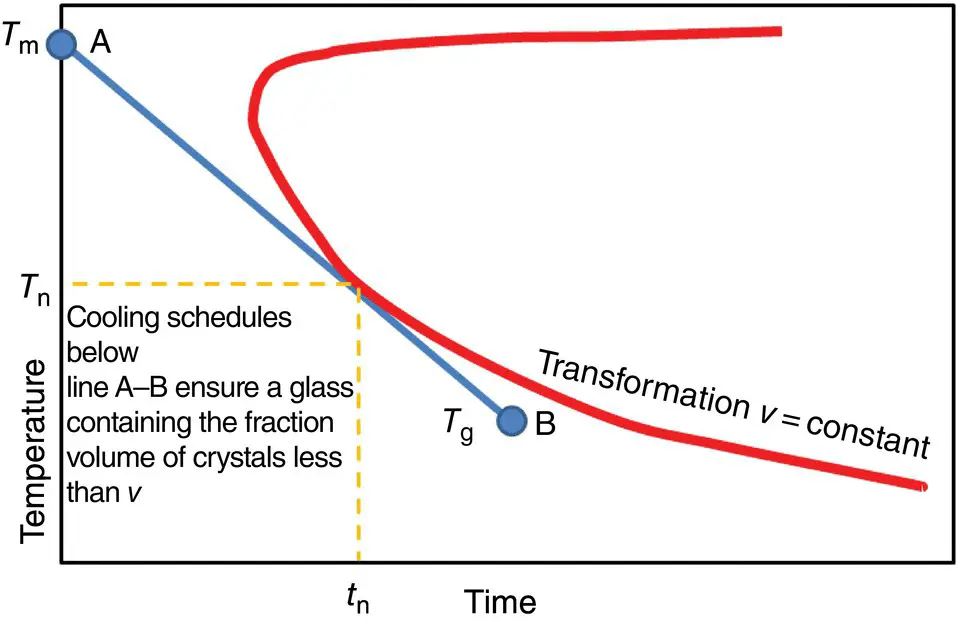
Figure 3 Determination of the critical cooling rate from a time temperature transformation diagram.
(4a) 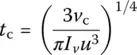
and
(4b) 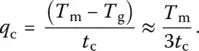
Despite its general correctness and qualitative agreement with experiments, the kinetic theory suffers from limited quantitative applications. Whereas quantitative agreement has been achieved for simple silicate systems, the discrepancy is of many orders of magnitude in most cases [6, 8].
In practice, the critical cooling rate (CCR) is determined from the so‐called time temperature transformation (TTT) diagrams, which represent nose‐shaped curves with a constant crystal fraction on time–temperature axes ( Figure 3). To ensure the obtention of a glass with a crystal volume fraction lower than v , it is required to follow a cooling pathway such that the cooling line (curve) will not touch the nose [10]. The CCR is then found as follows:
(5) 
Examples are listed in Table 1.
4 The Viscosity Factor
The definition of the glass transition in terms of the standard glass transition derived from the viscosity–temperature relationship, η ( T ), is not thermodynamic, but operational [8]. As determined from changes in second‐order derivatives of thermodynamic variables, the glass transition takes place at viscosities in the range 10 8–10 13Pa s depending on the cooling rate. In view of the very steep temperature dependence of viscosity, a great difference in this parameter results in only small variations of the operational T g.
Table 1 Critical cooling rate for some glasses, K/s.
Source: After [9].
| Material | Nucleation mechanism | |||
|---|---|---|---|---|
| Homogeneous | Heterogeneous θ = 100° | Heterogeneous θ = 60° | Heterogeneous θ = 40° | |
| SiO 2 | 9 × 10 −6 | 10 −5 | 8 × 10 −3 | 2 × 10 −1 |
| GeO 2 | 3 × 10 −3 | 3 × 10 −3 | 1 | 20 |
| Na 2O 2 SiO 2 | 6 × 10 −3 | 8 × 10 −3 | 10 | 3 × 10 2 |
| Salol [C 13H 10O 3] | 10 | |||
| Water | 10 7 | |||
| Ag | 10 10 |
As has long been recognized, glass formation is therefore easier in eutectic regions because freezing‐point depressions enable lower temperatures and higher viscosities to be reached [11]. However, viscosity at the liquidus is not a single scaling parameter for assessing glass‐forming ability. The temperature dependence of the viscosity below T mmust also be considered because vitrification takes place much below the liquidus [6, 8].
Viscous flow in glass‐forming liquids is characterized by deviations from Arrhenius laws with an activation energy Q that decreases from a high Q Hnear the glass transition to a low Q Lat superliquidus temperatures. As a fragility index characterizing the temperature dependence of viscosity, Doremus [12] has proposed the ratio:
(6) 
Short (or fragile) and long (or strong) glass melts are, therefore, characterized by R Dvalues higher and lower than 2, respectively.
Many equations have been proposed to express viscosity–temperature relationships ( Chapter 4.1, [13–15]). Consistent with Doremus criterion, an exponential expression with activation energies Q Land Q Hat low and high temperatures, respectively, [13] will be used here because it results from the configuron percolation theory (CPT), which accounts for viscous flow in terms of elementary excitations resulting from broken bonds named configurons [14, 16]. This equation (Sheffield model) is
( 7) 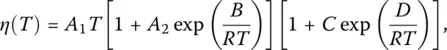
where A 1= k /6 πrD 0, A 2= exp(− S m/ R ), B = H m, C = exp(− S d/ R ) and D = H d, R the gas constant, k Boltzmann constant, r the configuron radius D 0= fgλ 2 zp 0 ν 0, f the correlation factor, g a geometrical factor (~1/6), λ the average jump length, ν 0the configuron vibrational frequency or the frequency (with which the configuron attempts to surmount the energy barrier to jump into a neighboring site), z the number of nearest neighbors, p 0a configuration factor, H dthe enthalpy, S dthe entropy of formation, and H mand S mthe enthalpy and entropy of motion of the configurons.
In practice, one finds that A 2exp( B / RT ) > > 1, i.e. that four parameters usually suffice for Eq. (7)to be fitted to practically all available experimental viscosity data [17]. Comparison with other viscosity models and numerical calculations have confirmed the excellent description of the viscosity provided by Eq. (7)for simple and complex organic and inorganic compositions (e.g. [13]). This equation can be readily approximated within narrow temperature intervals by expressions derived from the well‐known Vogel‐Tammann‐Fulcher, Adam–Gibbs, Avramov–Milchev, or Sanditov models [14, 15, 17]. It can be used at all temperatures and gives the correct Arrhenius‐type asymptotes at high and low temperatures, namely η ( T ) ~ exp( Q H/ RT ) at T << T g, and η ( T ) ~ exp( Q L/ RT ) at T >> T g, where Q H= H d+ H mand Q L= H m. Obviously, the activation energy of viscosity reduces to a low value equal to H mat high temperatures when temperature fluctuations create plenty of configurons. In contrast, some bonds need to be broken in the glassy state as temperature fluctuations do not create them effectively so that the activation energy then takes its full value Q H= H d+ H m.
5 Structural Factors
Apart from inhomogeneities and potential phase separation, glasses lack long‐range order but do possess short‐ and medium‐range ordering ( Chapter 2.1). A number of models have aimed at revealing the most characteristic structural aspects of good glass formers. The most noted structural criterion for ready glass formation, i.e. at rates q clower than 10 K/s, is based on Zachariasen theory in which the oxide glasses A mO nare assumed to be 3‐D networks obeying four rules: (i) the oxygen is linked to two atoms of A; (ii) the oxygen coordination number around A is three or four; (iii) the cation polyhedra share corners; and (iv) at least three corners are shared [18]. This theory is referred to as crystallochemical, but was applicable only to oxide glasses in its original form; it led to the so‐called 3‐D continuous random network (CRN) model ( Chapter 2.1). With respect to a glass and its isochemical crystal, the basic postulates of CRN are that: (i) interatomic forces are similar in both phases; (ii) the glass is in a slightly higher energy state; (iii) nearest‐neighbor coordination polyhedra are similar; and (iv) the nature of interatomic bonds is also similar.
Читать дальшеИнтервал:
Закладка:
Похожие книги на «Encyclopedia of Glass Science, Technology, History, and Culture»
Представляем Вашему вниманию похожие книги на «Encyclopedia of Glass Science, Technology, History, and Culture» списком для выбора. Мы отобрали схожую по названию и смыслу литературу в надежде предоставить читателям больше вариантов отыскать новые, интересные, ещё непрочитанные произведения.


Обсуждение, отзывы о книге «Encyclopedia of Glass Science, Technology, History, and Culture» и просто собственные мнения читателей. Оставьте ваши комментарии, напишите, что Вы думаете о произведении, его смысле или главных героях. Укажите что конкретно понравилось, а что нет, и почему Вы так считаете.