A. Kayode Coker - Petroleum Refining Design and Applications Handbook
Здесь есть возможность читать онлайн «A. Kayode Coker - Petroleum Refining Design and Applications Handbook» — ознакомительный отрывок электронной книги совершенно бесплатно, а после прочтения отрывка купить полную версию. В некоторых случаях можно слушать аудио, скачать через торрент в формате fb2 и присутствует краткое содержание. Жанр: unrecognised, на английском языке. Описание произведения, (предисловие) а так же отзывы посетителей доступны на портале библиотеки ЛибКат.
- Название:Petroleum Refining Design and Applications Handbook
- Автор:
- Жанр:
- Год:неизвестен
- ISBN:нет данных
- Рейтинг книги:3 / 5. Голосов: 1
-
Избранное:Добавить в избранное
- Отзывы:
-
Ваша оценка:
Petroleum Refining Design and Applications Handbook: краткое содержание, описание и аннотация
Предлагаем к чтению аннотацию, описание, краткое содержание или предисловие (зависит от того, что написал сам автор книги «Petroleum Refining Design and Applications Handbook»). Если вы не нашли необходимую информацию о книге — напишите в комментариях, мы постараемся отыскать её.
Petroleum Refining Design and Applications Handbook — читать онлайн ознакомительный отрывок
Ниже представлен текст книги, разбитый по страницам. Система сохранения места последней прочитанной страницы, позволяет с удобством читать онлайн бесплатно книгу «Petroleum Refining Design and Applications Handbook», без необходимости каждый раз заново искать на чём Вы остановились. Поставьте закладку, и сможете в любой момент перейти на страницу, на которой закончили чтение.
Интервал:
Закладка:
Flowsheet size may vary depending upon the references of the individuals using them. The most popular system uses one size sheet about 24 × 36 inches for all flowsheets. The use of miscellaneous large and small sizes to represent the entire project is often awkward when collected, and increases the possibilities of sheets becoming misplaced. Some groups use sheets from a roll and these are sized to length by systems, becoming 24 × 60 inches, and 24 × 72 inches or longer. These are fine for initial study but become tedious to handle on the usual desk. These sheets can be reduced to 11 × 36 inches or 11 × 48 inches both of which are more convenient to work with. These strip-type sheets allow large portions of the process to be grouped together, and are adaptable for folding into reports, and so on.
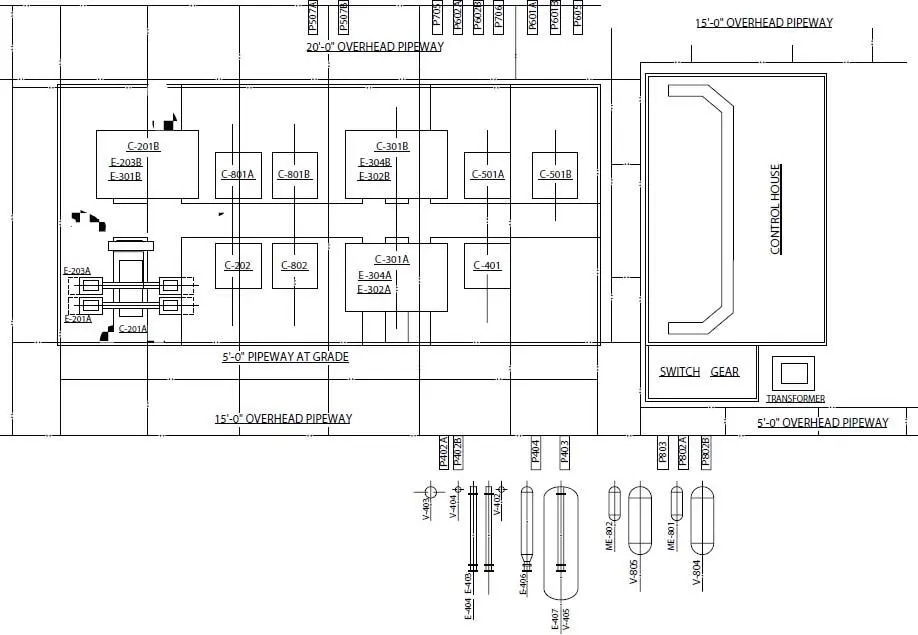
Figure 14.13 Typical process area plot plan and study elevations [9].
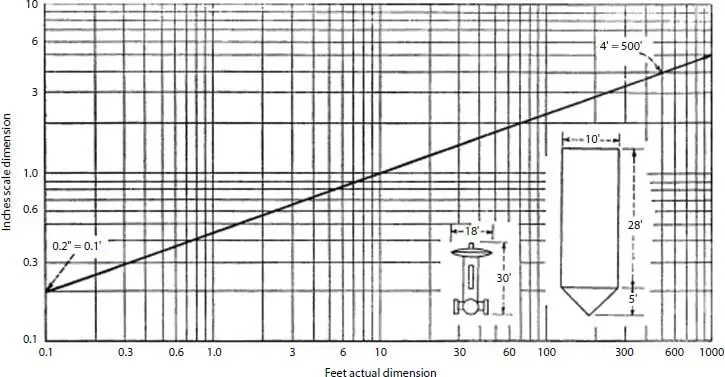
Figure 14.14 Flowsheet scale reference diagram [11].
Since the flowsheet is the primary reference for all engineers working on a project, it must contain all of the decisions, data, flow connections, vents, drains, and so on, which can reasonably be included without becoming confusing and difficult to read.
It is important that the various items of equipment and valves be spaced, pictorially represented and sized as to be easy to read, recognized, and followed. On the surface this may sound easy, while in reality it takes an experienced flowsheet detailer to arrange the various items in an eye pleasing and efficient arrangement. Suggestive outline figures plus shading often yield the best looking flowsheet; however, the extra time for detail costs time and money. Some compromise is often indicated. Reference to the various flowsheets illustrated here indicates that the equipment can be arranged by (1) working from a base line and keeping all heights relative and (2) by placing the various items in a straight-through flow pattern without relative heights. The first scheme is usually preferred for working flowsheets. Whenever possible, all auxiliary as well as spare equipment is shown. This facilitates the full and proper interpretation of all the details.
Figure 14.14[11] can be used as a guide in establishing relative sizes of equipment as represented on a flowsheet. This chart is based on approximate relative proportions pictured by the mind’s eye [11]. For example, the 10-foot diameter × 33-foot high tank would scale to 1.5 in. high. By using the height-developed scale factor, the diameter would be (1.5″/33′) (10′) = 0.45″ or say 0.5″ diameter on the flowsheet.
For some purposes the addition of equipment specification and performance data on the flowsheets adjacent to the item is of value. In many cases though, this additional information makes the sheets difficult to read. The use of equipment summary tables similar to flow and pipe data tables can avoid this objection and yet keep the information on the sheets. Some flowsheets include relief valve set pressures adjacent to the valves, volume capacities of storage tanks, and so on.
14.8 Computer-Aided Flowsheet Design/Drafting
As the fundamental documents (apart from the process flow diagrams) of any sound chemical/process engineering designs, piping and instrumentation diagrams (P&IDs) are arguably in terms of effort, the most demanding, current technology allows the use of computer programs and databases to construct an accurate and detailed flowsheet. This may be a process type diagram or a piping and mechanical/instrument diagram, depending on the input, electrical structural, and so on.
Table 14.2 Three programs offer a different mix of features.
| Procede | AutoPLANT | CADPIPE | |
| AutoCAD required | No | Yes | Yes |
| Automatic line breaks for symbols | Yes | Yes | Yes |
| Automatic line clash | Yes | Yes | Yes |
| Rotate command required for symbols | No | No | Yes |
| Specification checking available | No | Yes | Yes |
| Dual automatic tagging | No | Yes | Yes |
| Data form with secondary tag | No | No | Yes |
| Automatic signal connect | No | Yes | No |
Source: J.L. Viola [12].
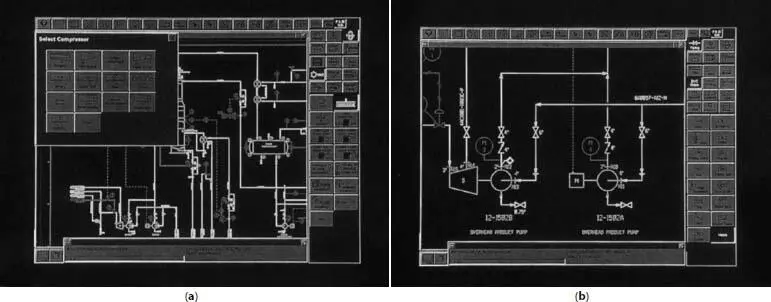
Figure 14.15 (a) Computer-generated P & ID flowsheet [9] (b) Computer-generated instrumentation detail for P & ID flowsheet [9].
Since the advent of computer aided design (CAD), most notably represented by AutoCAD, several software packages have been more recently introduced for piping, structural, mechanical, and process drawings. These software packages conform to the chemical process industries standard techniques that are common to most process designs. For examples, the use of universally recognizable symbols for pumps, compressors, vessels and tanks, piping, and valves, and the acceptance of Instrument Society of America (ISA) standard symbols to describe instrumentation. These software packages (e.g., VISIO, CADPIPE, AutoPLANT, and PROCEDE) provide users via “pull-down” menus extensive symbol libraries and provide lists and graphics of the components that are required to produce P&IDs, and piping isometrics. Viola [12] has reviewed three of these software packages, and Table 14.2shows the key features of these packages. See Figures 14.8, 14.9, 14.15a, and 14.15b.
Recently, intelligent P&IDs are being incorporated in plant operations, where in the past P&IDs were hard copy drawings that were computer aided design (CAD) products. The latest generation of intelligent P&IDs uses software that incorporates commercial databases, thus allowing ease of integration to other applications such as calculation packages, inclusion of “smart objects,” data sheet information, ease of use and additional features that surpass CAD deliverables of P&IDs. Novak [13] provides the advantages of incorporating intelligent P&IDs during engineering procurement construction (EPC) phases in terms of reduced capital expense by lowering project costs and improved engineering and design work flow and time to the market. Intelligent P&IDs software enhances database access by separate design teams worldwide for concurrent engineering; its uses during procurement and construction phases include integrating with material management programs, easy creation of subcontractor packages and tracking of as-built changes. Table 14.3illustrates a number of uses of intelligent P&IDs by operations, resulting in significant return on investment (ROI).
Table 14.3 Uses of intelligent P&IDs by operations.
| Provides high integrity of P & ID data—no need to field verify for decision support | Integration with other operations supports software such as reliability solutions. Plant management (PM) or turnaround planning. |
| Provides fast access to accurate, current data to aid troubleshooting | Aids in planning and executing emergency or maintenance procedures. |
| Allows change filtering and recording of updates to meet regulatory compliance | HAZOP analysis for safety checks and audit trails for OSHA, EPA and other compliance initiatives. |
| Shortened commissioning times | Risk-based inspection and critical system documentation. |
| Data filtration helps evaluate operational costs related to design scenarios | Production adjustments/reanalysis of process for feedstock variances. |
| Quicker startups | Allows multiple locations to view P & ID data. |
Source: Novak [13] By permission from Hydrocarbon Processing.
Читать дальшеИнтервал:
Закладка:
Похожие книги на «Petroleum Refining Design and Applications Handbook»
Представляем Вашему вниманию похожие книги на «Petroleum Refining Design and Applications Handbook» списком для выбора. Мы отобрали схожую по названию и смыслу литературу в надежде предоставить читателям больше вариантов отыскать новые, интересные, ещё непрочитанные произведения.


Обсуждение, отзывы о книге «Petroleum Refining Design and Applications Handbook» и просто собственные мнения читателей. Оставьте ваши комментарии, напишите, что Вы думаете о произведении, его смысле или главных героях. Укажите что конкретно понравилось, а что нет, и почему Вы так считаете.