Thomas N. Bulkowski - Encyclopedia of Chart Patterns
Здесь есть возможность читать онлайн «Thomas N. Bulkowski - Encyclopedia of Chart Patterns» — ознакомительный отрывок электронной книги совершенно бесплатно, а после прочтения отрывка купить полную версию. В некоторых случаях можно слушать аудио, скачать через торрент в формате fb2 и присутствует краткое содержание. Жанр: unrecognised, на английском языке. Описание произведения, (предисловие) а так же отзывы посетителей доступны на портале библиотеки ЛибКат.

- Название:Encyclopedia of Chart Patterns
- Автор:
- Жанр:
- Год:неизвестен
- ISBN:нет данных
- Рейтинг книги:3 / 5. Голосов: 1
-
Избранное:Добавить в избранное
- Отзывы:
-
Ваша оценка:
Encyclopedia of Chart Patterns: краткое содержание, описание и аннотация
Предлагаем к чтению аннотацию, описание, краткое содержание или предисловие (зависит от того, что написал сам автор книги «Encyclopedia of Chart Patterns»). Если вы не нашли необходимую информацию о книге — напишите в комментариях, мы постараемся отыскать её.
, Third Edition expands upon Bulkowski's immensely popular Second Edition with fully revised and updated material on chart patterns. Whether you’re new to the stock market or an experienced professional trader, use this book as a reference guide to give you an edge.
Within the pages of this book, you’ll learn how to identify chart patterns, supported by easy-to-understand performance statistics describing how well a pattern works, what the failure rate is, and what special quirks suggest better future performance. You’ll discover how often a stop loss order will trigger at various locations within a chart pattern, how the chart pattern’s performance has evolved over the past three decades, and how to profit from failure by trading busted patterns.
This broadened and revised
offers investors the most comprehensive, up-to-date guide to this popular method of market analysis. Written by a leading expert on chart patterns, Tom Bulkowski, this edition includes revised statistics on 75 chart patterns including 23 new ones, with pictures and performance statistics, packaged within easy-to-read text.
Gain essential knowledge of chart patterns and how they are used to predict price movements in bull and bear markets New tables include how often stops are hit, busted pattern performance, performance over the decades, and special pattern features Joining Tour, Identification Guidelines, Focus on Failures, Statistics, Trading Tactics and Sample Trade is Experience. It puts you in the passenger’s seat so you can share lessons learned from Bulkowski's trades This edition reports on statistics from nearly four times the number of samples used in the Second Edition and ten times the number in the , Third Edition further solidifies the reputation of this book as the leading reference on chart patterns, setting it far above the competition.
Encyclopedia of Chart Patterns — читать онлайн ознакомительный отрывок
Ниже представлен текст книги, разбитый по страницам. Система сохранения места последней прочитанной страницы, позволяет с удобством читать онлайн бесплатно книгу «Encyclopedia of Chart Patterns», без необходимости каждый раз заново искать на чём Вы остановились. Поставьте закладку, и сможете в любой момент перейти на страницу, на которой закончили чтение.
Интервал:
Закладка:
If the pattern worked as he hoped, the CD leg would equal or exceed the AB leg and make for a tasty profit.
The height of the AB move was 43.14 – 37.13 or 6.01. Added to the low at C (38.42) gave a target for turn D of 44.43.
“I doubled my position right there,” he said and poked the screen, leaving a fingerprint behind. The second buy was near C, and he set a target to sell both positions at 44.43. “I raised my stop, too, to a penny below C. Just in case…”
The stock took off in a straight‐line run up to D. The stock sold at the exact high at D, 44.43, cashing him out of the AB=CD trade and also out of the double bottom trade.
“Let's do lunch,” he said. “I'll let you buy.”
3 AB=CD ®, Bullish
RESULTS SNAPSHOT
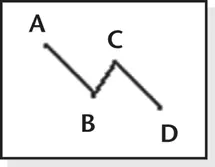
Appearance: A zigzag pattern that has four turns, two of which are governed by Fibonacci ratios.
Upward Moves
| Bull Market | Bear Market | |
| Performance rank | 4 out of 5 | 3 out of 5 |
| Breakeven failure rate | 11.6% | 3.7% |
| Average rise | 38.4% | 30.5% |
| Volume trend | Upward | Upward |
| Point D reversal rate | 38% | 33% |
| How many reach point D? | 100% | 99% |
| See also | Bullish bat, bullish butterfly, bullish crab, bullish Gartley, measured move down |
The bullish AB=CD pattern is a type of measured move down except that the pattern's turns are determined by Fibonacci ratios. I measured performance of Fibonacci‐based patterns differently than I do other chart pattern types. That's because we're looking for a reversal at the end of the pattern and not an up or down breakout. Therefore, the layout of this chapter is different from most other chapters in this book.
The theory behind this pattern is that if you know the first three turns (ABC), you can calculate the fourth turn (D). The method works nearly all of the time, meaning price does fall to the calculated point D. However, when price reaches D, it fails to reverse there. Only about a third (33% in bear markets and 38% in bull markets) will see price turn upward when it's supposed to.
Of course, your software for identifying the bullish AB=CD may be different than the model I built, so your performance may vary. Add trading rules to improve performance and you may find this pattern a useful tool. Let's see what this pattern looks like.
Tour
Figure 3.1shows an example of a bullish AB=CD. Price begins the pattern at peak A after an exhaustion gap warns of the coming retrace. The pattern completes at valley D, with turn BC nestled comfortably between those two points. Notice that price turned at D and climbed from there (at least for a time). Price reversing at D and climbing is how the pattern is supposed to work.
In this example, price broke out of the pattern upward at F when it closed above the top of the pattern. Not shown, but the stock continued higher to rise 119% above the low at D. If only all chart patterns worked like that!
This chart is also a good example of the CD leg meeting the projection of AB. In other words, the height of AB subtracted from C gives turn D. Thus, if you know turns ABC, you can estimate where D will appear. However, you can also use that price information to predict where D will be using Fibonacci numbers (because turn D can be far away from the ABC turns). I'll discuss that in the next section.
Notice volume (E) trends downward in this example. A downward volume trend happens 47% of the time in a bull market (meaning an upward trend is slightly more likely). An upward volume trend helps boost performance, and we'll see how much in the Statistics section.

Figure 3.1 This chart shows how a bullish AB=CD pattern sees price turn at D.
Identification Guidelines
Table 3.1shows the identification guidelines, and Figure 3.2shows an example of a bullish AB=CD pattern.
Appearance.Bullish AB=CD patterns are a member of what I call Fibonacci patterns whose turns are set by Fibonacci ratios. I don't suggest you try finding this pattern manually. Rather, use pattern recognition software that can hunt down these patterns like a cat hunts mice. I found so many in my quest to count them that I ran out of fingers and toes and had to limit the number a stock could report.
Table 3.1 Identification Guidelines
| Characteristic | Discussion |
|---|---|
| Appearance | A zigzag pattern that has four turns, two of which are governed by Fibonacci ratios. |
| CB/AB retrace | The retrace should be one of the Fibonacci numbers: .382, .5, .618, .707, .786, or .886. |
| CD/CB extension | The extension should be one of the Fibonacci numbers: 1.13, 1.27, 1.41, 1.618, 2, 2.24, 2.618, or 3.14. |
| Hills and valleys | From A to B, there should be no peak higher than A and no valley lower than B. From B to C, there should be no peak higher than C and no valley lower than B. From C to D, there should be no valley lower than D and no peak higher than C. |
| Volume | The volume trend provides a slight performance improvement depending on the bull or bear market condition. See Table 3.2. |
| Duration | Limited to 6 months, but that's an arbitrary value. |

Figure 3.2 Another example of a bullish AB=CD pattern with an upward breakout (when price closes above the top of the pattern).
CB/AB retrace.The BC retrace of AB should be one of the Fibonacci numbers listed in Table 3.1. Let's use the pattern shown in Figure 3.2as an example of how this works (rather, how I wrote my software to find these patterns).
The high price at A is 228.89, the low at B is 213.12, and the high at C is 225.45. The CB/AB ratio is (225.45 – 213.12)/(228.89 – 213.12) or .782, which is darn close to the .786 number in the table. It qualifies as a proper turn. My software looks for a number within a window .5% of the target numbers listed in the table.
Once you know the ABC turn, you can determine what D should be priced at. In this example D = C – (A – B) or 209.68, which is close to the actual low at D of 209.62.
CD/CB extension.Point D can also be found by the formula C – (C – B)/(Fibonacci number) or 225.45 – (225.45 – 213.12)/.786 in this example. The result is 209.76.
Hills and valleys.The table explains the requirements of peaks and valleys between the various points in the pattern.
Volume.Volume trends upward from points A to D most often, but the trend is almost random.
Duration.I limited patterns to 6 months duration or less. This is an arbitrary limit.
Focus on Failures
Figure 3.3shows one example of how this pattern fails. The four points in the pattern are labeled as ABCD, and they comprise the bullish AB=CD pattern. Volume slopes upward in this example, shown by the diagonal line at E.
Читать дальшеИнтервал:
Закладка:
Похожие книги на «Encyclopedia of Chart Patterns»
Представляем Вашему вниманию похожие книги на «Encyclopedia of Chart Patterns» списком для выбора. Мы отобрали схожую по названию и смыслу литературу в надежде предоставить читателям больше вариантов отыскать новые, интересные, ещё непрочитанные произведения.


Обсуждение, отзывы о книге «Encyclopedia of Chart Patterns» и просто собственные мнения читателей. Оставьте ваши комментарии, напишите, что Вы думаете о произведении, его смысле или главных героях. Укажите что конкретно понравилось, а что нет, и почему Вы так считаете.