Thomas N. Bulkowski - Encyclopedia of Chart Patterns
Здесь есть возможность читать онлайн «Thomas N. Bulkowski - Encyclopedia of Chart Patterns» — ознакомительный отрывок электронной книги совершенно бесплатно, а после прочтения отрывка купить полную версию. В некоторых случаях можно слушать аудио, скачать через торрент в формате fb2 и присутствует краткое содержание. Жанр: unrecognised, на английском языке. Описание произведения, (предисловие) а так же отзывы посетителей доступны на портале библиотеки ЛибКат.

- Название:Encyclopedia of Chart Patterns
- Автор:
- Жанр:
- Год:неизвестен
- ISBN:нет данных
- Рейтинг книги:3 / 5. Голосов: 1
-
Избранное:Добавить в избранное
- Отзывы:
-
Ваша оценка:
Encyclopedia of Chart Patterns: краткое содержание, описание и аннотация
Предлагаем к чтению аннотацию, описание, краткое содержание или предисловие (зависит от того, что написал сам автор книги «Encyclopedia of Chart Patterns»). Если вы не нашли необходимую информацию о книге — напишите в комментариях, мы постараемся отыскать её.
, Third Edition expands upon Bulkowski's immensely popular Second Edition with fully revised and updated material on chart patterns. Whether you’re new to the stock market or an experienced professional trader, use this book as a reference guide to give you an edge.
Within the pages of this book, you’ll learn how to identify chart patterns, supported by easy-to-understand performance statistics describing how well a pattern works, what the failure rate is, and what special quirks suggest better future performance. You’ll discover how often a stop loss order will trigger at various locations within a chart pattern, how the chart pattern’s performance has evolved over the past three decades, and how to profit from failure by trading busted patterns.
This broadened and revised
offers investors the most comprehensive, up-to-date guide to this popular method of market analysis. Written by a leading expert on chart patterns, Tom Bulkowski, this edition includes revised statistics on 75 chart patterns including 23 new ones, with pictures and performance statistics, packaged within easy-to-read text.
Gain essential knowledge of chart patterns and how they are used to predict price movements in bull and bear markets New tables include how often stops are hit, busted pattern performance, performance over the decades, and special pattern features Joining Tour, Identification Guidelines, Focus on Failures, Statistics, Trading Tactics and Sample Trade is Experience. It puts you in the passenger’s seat so you can share lessons learned from Bulkowski's trades This edition reports on statistics from nearly four times the number of samples used in the Second Edition and ten times the number in the , Third Edition further solidifies the reputation of this book as the leading reference on chart patterns, setting it far above the competition.
Encyclopedia of Chart Patterns — читать онлайн ознакомительный отрывок
Ниже представлен текст книги, разбитый по страницам. Система сохранения места последней прочитанной страницы, позволяет с удобством читать онлайн бесплатно книгу «Encyclopedia of Chart Patterns», без необходимости каждый раз заново искать на чём Вы остановились. Поставьте закладку, и сможете в любой момент перейти на страницу, на которой закончили чтение.
Интервал:
Закладка:
As I mentioned, the pattern's turns are found using Fibonacci numbers. Let's go through this pattern to see how the bat in Figure 4.2qualifies.
BA/XA retrace.The ratio of leg BA to XA should be either .382 or .5. Here are the prices used in the retrace or extension calculations for the bearish bat. The high price of point X is 56.93. The low at point A is 47.81, B peaks at 52.00, C bottoms at 49.71, and the pattern ends at D with a high price of 55.98.
To determine the retrace, I use the height (high–low range) of the price bar at the target to determine whether or not it spans a Fibonacci number. For example, the BA/XA turn using the high price of B would be (52.00 – 47.81)/(56.93 – 47.81) or .46. Using the low price at B (50.90) in the equation gives (50.90 – 47.81)/(56.93 – 47.81) or .34. The range .34 to .46 straddles the .382 Fibonacci number, so I allow it as a valid XAB turn.
Using this method gives a lot of leeway to the pattern's turns but even so, the pattern is rare. Trying to narrow the turn window would limit even more patterns from being found, so this is the algorithm I chose. The software you use may think differently.
BC/BA retrace.In a manner similar to the BA/XA retrace, I plugged in the numbers for the BC/BA retrace (using the low at C). They are (52 – 49.71)/(52 – 47.81) or .55. Using the high at C (51.65) gives (52 – 51.65)/(52 – 47.81) or .08. The range of .08 to .55 encompasses .382 and .5, so I allow the turn as valid.
DC/BC extension.In a similar manner, I find the DC extension of BC. That's (55.98 – 49.71)/(52 – 49.71) or 2.74. Using the low at D (54), we get an extension of 1.87. The 1.87 to 2.74 values straddle all of the listed numbers (any one of which will suffice) except 1.618, so it qualifies as a valid extension.
DA/XA retrace.Supposedly, this ratio is critical, so I allow point D to miss the number by 3% (.03). I do not use the high–low range of D in the equation and I use 3% instead of 1% because this pattern is rare enough as it is. We have (55.98 – 47.81)/(56.93 – 56.93) or .9. The .9 value is near the .886 target, so the pattern qualifies as a valid bearish bat.
As you can imagine, computing these ratios by hand is tedious and error prone, so I programmed my computer to find bats by first finding all peaks and valleys and then using the method described to glue them together.
Volume.I'll discuss a few volume statistics in Table 4.2, but volume trends downward in the pattern most of the time. With few samples, it's difficult to say whether up or down trending volume leads to better or worse performance, but current statistics favor a downward volume trend for the best performance.
Duration.I limited patterns to a length of 6 months or less. That's an arbitrary limitation.
Table 4.2General Statistics
| Description | Bull Market | Bear Market |
|---|---|---|
| Number found | 537 | 128 |
| Breakeven failure rate | 17.7% | 4.5% |
| Average decline after D | –14.3% | –20.2% |
| Volume trend | 74% Downward | 67% Downward |
| Performance Up/Down volume | –14%U, –15%D | –20%U, –20%D |
Focus on Failures
Figure 4.3shows a failure of a bearish bat pattern. Why is it a failure? As the name implies ( bearish bat, not bullish), price should drop after point D (meaning price should trend lower after the pattern ends). However, price continues trending higher in this example. Price closes above the top of the pattern (X) at point E, posting an upward breakout.
I checked the statistics and found that 70% of the 665 bats I looked at break out upward, regardless of the market condition (bull or bear). Don't let that number give you nightmares. As awful as the 70% number is, it doesn't tell the complete story. Swing traders will soon learn (as discussed in Table 4.2) that price turns lower at point D 86% of the time. Price may still break out upward, as Figure 4.3shows, but maybe you can make money when price drops between D and the breakout.
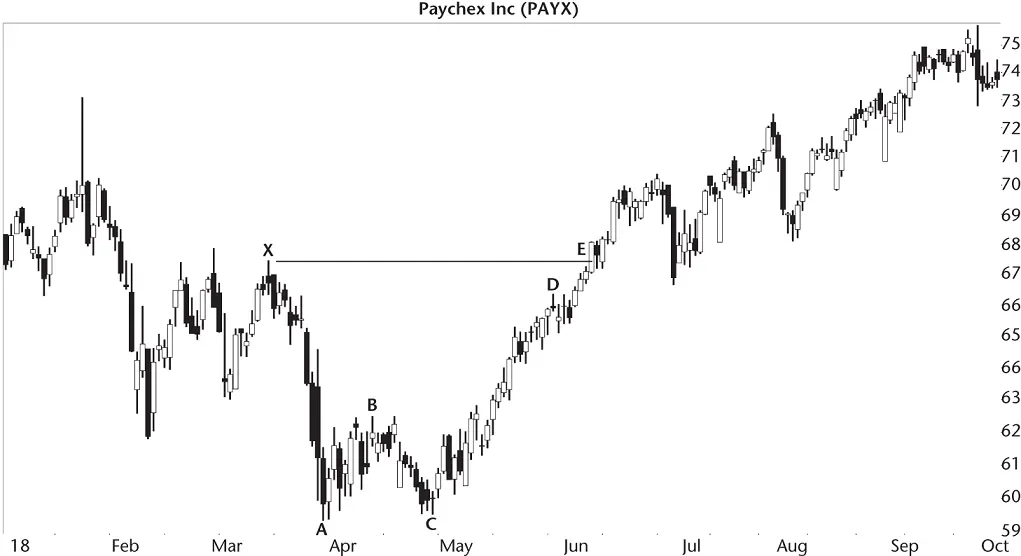
Figure 4.3 This bearish bat isn't bearish at all.
I don't show this situation in Figure 4.3, but if price does turn lower at D but drops less than or equal to 5%, then that's also a failure. If you were to trade a pattern with a 5% failure, you'd be hard pressed to make money. The 5% failure rate (also called the breakeven failure rate) is 17.7% for this pattern in bull markets (but just 4.5% in bear markets).
Since I'm throwing around a lot of numbers, let's discuss statistics.
Statistics
Table 4.2shows general statistics related to the bearish bat pattern.
Number found.Despite using the high–low price range at most of the Fibonacci turns, as I discussed in the Identification Guidelines, few bats appear in the historical price record. I found them in 491 stocks despite searching from June 1991 to August 2019. Not all stocks covered the entire period and some no longer trade.
Breakeven failure rate.I counted the number of patterns which saw price drop no more than 5% after peaking at D (using the high price at D to the ultimate low). The table shows the failure rate. Anything above zero is too high, but that's in an ideal world. The bear market failure rate, at 4.5%, is terrific. The 17.7% failure rate in bull markets is not so terrific.
When you consider that a declining price trend in bull markets is like swimming against the current, you would expect a high failure rate. Swim with the bear market current and the failure rate drops to one‐fourth the bull market rate.
Average decline after D.Point D ends the pattern and price is supposed to head lower. The average decline is 14.3% in bull markets but substantially better in bear markets, over 20%.
Volume trend, performance.I measured the volume trend using linear regression but often you can tell the trend just by looking at the chart. Figure 4.2, for example, shows volume (E) higher on the left half of the pattern than the right half, so the trend is downward. In fact, the average bearish bat will have a downward volume trend at least most of the time.
Does the volume trend give us any hint of better or worse performance? Not that you'd notice. The widest spread between the two numbers is one percentage point in bull markets. That's probably not statistically significant.
Trading Tactics
The real purpose of the bearish bat is for swing traders to predict the turn at D and then go short, anticipating a drop to the bottom of the pattern. Will price sink that far? Maybe, maybe not. Let's look at some number to see if we can model behavior better.
Table 4.3 Price Move after Pattern End
| Description | Bull Market | Bear Market |
|---|---|---|
| How often does price turn at D? | 86% | 86% |
| How many drop to point A? | 35% | 38% |
| How many drop to point B? | 81% | 80% |
| How many drop to point C? | 48% | 46% |
Table 4.3uses numbers to show how price behaves after the pattern completes at D.
How often does price turn at D?At the end of the pattern, price can form a minor high at D or price can continue trending upward (as in a straight‐line run up). Most of the time (86%), the stock will form a minor high at D. To find the reversal rate, I checked for a minor high appearing there (that is, I checked to see if price actually turned lower). Figure 4.3shows an example where the stock failed to turn significantly lower at D.
Читать дальшеИнтервал:
Закладка:
Похожие книги на «Encyclopedia of Chart Patterns»
Представляем Вашему вниманию похожие книги на «Encyclopedia of Chart Patterns» списком для выбора. Мы отобрали схожую по названию и смыслу литературу в надежде предоставить читателям больше вариантов отыскать новые, интересные, ещё непрочитанные произведения.


Обсуждение, отзывы о книге «Encyclopedia of Chart Patterns» и просто собственные мнения читателей. Оставьте ваши комментарии, напишите, что Вы думаете о произведении, его смысле или главных героях. Укажите что конкретно понравилось, а что нет, и почему Вы так считаете.