Thomas N. Bulkowski - Encyclopedia of Chart Patterns
Здесь есть возможность читать онлайн «Thomas N. Bulkowski - Encyclopedia of Chart Patterns» — ознакомительный отрывок электронной книги совершенно бесплатно, а после прочтения отрывка купить полную версию. В некоторых случаях можно слушать аудио, скачать через торрент в формате fb2 и присутствует краткое содержание. Жанр: unrecognised, на английском языке. Описание произведения, (предисловие) а так же отзывы посетителей доступны на портале библиотеки ЛибКат.

- Название:Encyclopedia of Chart Patterns
- Автор:
- Жанр:
- Год:неизвестен
- ISBN:нет данных
- Рейтинг книги:3 / 5. Голосов: 1
-
Избранное:Добавить в избранное
- Отзывы:
-
Ваша оценка:
Encyclopedia of Chart Patterns: краткое содержание, описание и аннотация
Предлагаем к чтению аннотацию, описание, краткое содержание или предисловие (зависит от того, что написал сам автор книги «Encyclopedia of Chart Patterns»). Если вы не нашли необходимую информацию о книге — напишите в комментариях, мы постараемся отыскать её.
, Third Edition expands upon Bulkowski's immensely popular Second Edition with fully revised and updated material on chart patterns. Whether you’re new to the stock market or an experienced professional trader, use this book as a reference guide to give you an edge.
Within the pages of this book, you’ll learn how to identify chart patterns, supported by easy-to-understand performance statistics describing how well a pattern works, what the failure rate is, and what special quirks suggest better future performance. You’ll discover how often a stop loss order will trigger at various locations within a chart pattern, how the chart pattern’s performance has evolved over the past three decades, and how to profit from failure by trading busted patterns.
This broadened and revised
offers investors the most comprehensive, up-to-date guide to this popular method of market analysis. Written by a leading expert on chart patterns, Tom Bulkowski, this edition includes revised statistics on 75 chart patterns including 23 new ones, with pictures and performance statistics, packaged within easy-to-read text.
Gain essential knowledge of chart patterns and how they are used to predict price movements in bull and bear markets New tables include how often stops are hit, busted pattern performance, performance over the decades, and special pattern features Joining Tour, Identification Guidelines, Focus on Failures, Statistics, Trading Tactics and Sample Trade is Experience. It puts you in the passenger’s seat so you can share lessons learned from Bulkowski's trades This edition reports on statistics from nearly four times the number of samples used in the Second Edition and ten times the number in the , Third Edition further solidifies the reputation of this book as the leading reference on chart patterns, setting it far above the competition.
Encyclopedia of Chart Patterns — читать онлайн ознакомительный отрывок
Ниже представлен текст книги, разбитый по страницам. Система сохранения места последней прочитанной страницы, позволяет с удобством читать онлайн бесплатно книгу «Encyclopedia of Chart Patterns», без необходимости каждый раз заново искать на чём Вы остановились. Поставьте закладку, и сможете в любой момент перейти на страницу, на которой закончили чтение.
Интервал:
Закладка:
“I actually think this will be a loser trade, but broadening top chapter in new book [this one] says it is a strong candidate to buy. I expect a partial rise with downside breakout. Upside is formation top at 35, downside is stop‐loss at 27.30, call it 27.25, for a 10% decline. If it closes below 28, that is sell signal. Dump immediately. Filled at 30.39.”
I didn't buy exactly at the bottom of the broadening bottom (28.20), so that's something I can improve on.
Lesson: Try to buy as close to the optimum entry price as possible (the lower trendline in this case).
The stock continued to move higher, but halfway up the chart pattern, it stalled. That's common and wasn't a cause for concern until price started backtracking.
“12 February 2001. I sold at 31.18 because of a partial rise on the broadening top. Since I believe this is going down, there was no sense to wait for it to close below 28 before dumping. I made a small profit, about 2.5%.”
For a swing trade, I got in late and exited late, too, hurting the profit margin. Looking at the chart, the picture looks like a head‐and‐shoulders top. The partial rise is the right shoulder, and it's at the height of the left shoulder. I should have been prepared for the stock to turn lower there because of the mirror on the left side of the pattern.
Lesson: As price moves, pay attention to the surrounding price landscape for clues to how the stock may behave. Look for support and resistance areas where the stock might reverse.
Lesson: Play with price mirrors.
Price mirror: Pick a vertical turning point on the price chart and reflect the left side of the chart onto the empty, right side. The peaks and valleys on the right, in the future, might match the ones that happened in the past. It's better than sex when it works, and it gives you some idea of what the future could bring.
For example, if you were to flip the chart across the head of a head‐and‐shoulders top, you'd see that the right shoulder will match the distance and price of the left shoulder. You can continue the analysis for the rest of the chart, too, giving both price and time on the turns.
Sample Trade
“If you wait long enough,” Sandra sold me, “you get rewarded.”
My stomach growled. I was wondering if she'd reward me with a meal. She's a terrific cook. Instead, she pulled up Figure 11.5on her computer screen.
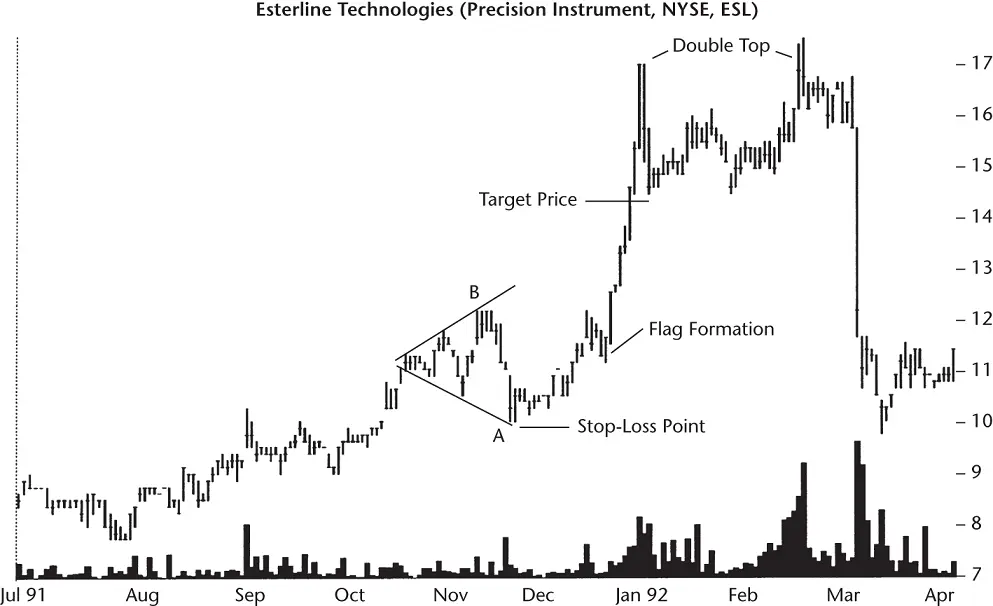
Figure 11.5 Use the measure rule to compute the target price. First, compute the formation height from the highest high to the lowest low, then add or subtract the height from the highest high or lowest low, respectively. Depending on the breakout direction, the result is the expected target price.
“Two days after the stock bottomed [at A], I bought at 10.50. I placed a stop 15 cents below the bottom of the pattern [below A] for a potential loss of 6%.”
She applied the measure rule and was looking at a target of 14.25. If everything worked as expected, that would give her a profit of over 35%.
“When price paused here,” she pointed near the start of the flag, “I wondered if the trend was going to reverse. I thought about cashing out and running to the bank, but didn't. I decided to drive.”
She winked at me and smiled at her pun.
“The flag formed, and I hoped it would be a half‐staff pattern, meaning the flag was halfway up the move.” If that were true, she could expect a climb to 13.25 (that is the distance from the top of the flag (12.13) to the start of the move at 10.00 projected upward using the lowest low in the flag at 11.13).
A few days later, the stock not only fulfilled the measure rule for the flag, but for the broadening top as well.
“Did you sell?”
“No.”
“Why not?”
“Because the stock was moving up. I decided to let my profits ride. However, I did raise my stop to 11.85,” which was below the top of the flag and also below the high at B. “I thought it was a support area and hoped the stock would rebound before taking me out.”
“In mid‐February, just after the second peaked at 17, I saw a potential double top pattern. I raised my stop to 15 cents below the double bottom's confirmation point, or 14.25.”
About 2 weeks after raising her stop, her position sold when the stock plunged from the prior close at 15.63 to 12.13. After commissions, she made 33% in less than 4 months.
My stomach growled again.
“Yes, I'll feed you. I make this killer Swiss cheese, macaroni, and veggies casserole, lightly topped with toasted breadcrumbs. It has enough carbs to power the city. Let's go.”
She grabbed my hand, towed me to her kitchen, and handed me a carrot peeler.
“What's this?” I asked.
Конец ознакомительного фрагмента.
Текст предоставлен ООО «ЛитРес».
Прочитайте эту книгу целиком, купив полную легальную версию на ЛитРес.
Безопасно оплатить книгу можно банковской картой Visa, MasterCard, Maestro, со счета мобильного телефона, с платежного терминала, в салоне МТС или Связной, через PayPal, WebMoney, Яндекс.Деньги, QIWI Кошелек, бонусными картами или другим удобным Вам способом.
Интервал:
Закладка:
Похожие книги на «Encyclopedia of Chart Patterns»
Представляем Вашему вниманию похожие книги на «Encyclopedia of Chart Patterns» списком для выбора. Мы отобрали схожую по названию и смыслу литературу в надежде предоставить читателям больше вариантов отыскать новые, интересные, ещё непрочитанные произведения.


Обсуждение, отзывы о книге «Encyclopedia of Chart Patterns» и просто собственные мнения читателей. Оставьте ваши комментарии, напишите, что Вы думаете о произведении, его смысле или главных героях. Укажите что конкретно понравилось, а что нет, и почему Вы так считаете.