Thomas N. Bulkowski - Encyclopedia of Chart Patterns
Здесь есть возможность читать онлайн «Thomas N. Bulkowski - Encyclopedia of Chart Patterns» — ознакомительный отрывок электронной книги совершенно бесплатно, а после прочтения отрывка купить полную версию. В некоторых случаях можно слушать аудио, скачать через торрент в формате fb2 и присутствует краткое содержание. Жанр: unrecognised, на английском языке. Описание произведения, (предисловие) а так же отзывы посетителей доступны на портале библиотеки ЛибКат.

- Название:Encyclopedia of Chart Patterns
- Автор:
- Жанр:
- Год:неизвестен
- ISBN:нет данных
- Рейтинг книги:3 / 5. Голосов: 1
-
Избранное:Добавить в избранное
- Отзывы:
-
Ваша оценка:
Encyclopedia of Chart Patterns: краткое содержание, описание и аннотация
Предлагаем к чтению аннотацию, описание, краткое содержание или предисловие (зависит от того, что написал сам автор книги «Encyclopedia of Chart Patterns»). Если вы не нашли необходимую информацию о книге — напишите в комментариях, мы постараемся отыскать её.
, Third Edition expands upon Bulkowski's immensely popular Second Edition with fully revised and updated material on chart patterns. Whether you’re new to the stock market or an experienced professional trader, use this book as a reference guide to give you an edge.
Within the pages of this book, you’ll learn how to identify chart patterns, supported by easy-to-understand performance statistics describing how well a pattern works, what the failure rate is, and what special quirks suggest better future performance. You’ll discover how often a stop loss order will trigger at various locations within a chart pattern, how the chart pattern’s performance has evolved over the past three decades, and how to profit from failure by trading busted patterns.
This broadened and revised
offers investors the most comprehensive, up-to-date guide to this popular method of market analysis. Written by a leading expert on chart patterns, Tom Bulkowski, this edition includes revised statistics on 75 chart patterns including 23 new ones, with pictures and performance statistics, packaged within easy-to-read text.
Gain essential knowledge of chart patterns and how they are used to predict price movements in bull and bear markets New tables include how often stops are hit, busted pattern performance, performance over the decades, and special pattern features Joining Tour, Identification Guidelines, Focus on Failures, Statistics, Trading Tactics and Sample Trade is Experience. It puts you in the passenger’s seat so you can share lessons learned from Bulkowski's trades This edition reports on statistics from nearly four times the number of samples used in the Second Edition and ten times the number in the , Third Edition further solidifies the reputation of this book as the leading reference on chart patterns, setting it far above the competition.
Encyclopedia of Chart Patterns — читать онлайн ознакомительный отрывок
Ниже представлен текст книги, разбитый по страницам. Система сохранения места последней прочитанной страницы, позволяет с удобством читать онлайн бесплатно книгу «Encyclopedia of Chart Patterns», без необходимости каждый раз заново искать на чём Вы остановились. Поставьте закладку, и сможете в любой момент перейти на страницу, на которой закончили чтение.
Интервал:
Закладка:
My notebook tells what I learned.
Lesson: If an upside breakout from partial decline does not appear immediately, sell.
Lesson: Do not buy more of a stock as it moves downward across the broadening pattern. Wait for it to bounce off the bottom trendline. Otherwise, the breakout could be downward, resulting in multiple losing trades.
Lesson: Close out the trade when the market tells you you're wrong.
National Fuel Gas
National Fuel Gas (NFG) in late 2004 formed a broadening pattern. This pattern broke out upward, and I bought the next day, the same day the stock closed back inside the pattern (I didn't know it at the time).
From my notebook: “9 March 2005. Buy reason: Busted triple top, upward breakout from RABFD [right‐angled broadening formation, descending]. The other natural gas companies have stocks that are moving up almost vertically. This one is pausing from recent gains in the rounding turn. Earnings are weak, but the market doesn't seem to mind. I expect the stock to move up as it follows the other natural gas companies higher. Earnings come out in April, and I expect them to be good, sending the stock higher. I think the price is anticipating a strong showing. The stop is a close one just in case (7% away).”
On 18 April, I have this curious entry: “I removed the stop intraday as I was getting used to my broker. The stock dipped below the stop price, but I didn't have a stop in place, so I wasn't taken out. Stop remains at 27.43.” To me that sounds confusing, as if I removed the stop and put it back in, too afraid that price would take me out. It worked this time, but it's not a habit you want to form.
On 29 April, I was stopped out of the stock and took a 6% loss. The timing of the sale is odd, though. I sold when the stock was about midway down the height of the broadening pattern. My assessment of the trade says that I sold too early.
Indeed, the stock continued lower. Two days later, the stock busted the upward breakout when it closed below the bottom of the pattern. But that was as far as it dropped. The stock climbed from there, busted the downward breakout, and soared like I thought it would originally. The stock peaked at 63.71 in May 2008, a massive 133% above my sale price. You probably heard me yelling at the time about missing another big gain.
I picked the right stock, at the right time, but watched from the sidelines as it became an eagle and soared. However, I think I traded this correctly. I bought the day after the breakout, so I got in quick at a good price and sold when it was clear the stock was dropping. Waiting for it to turn at the bottom of the pattern, in this case, was not a mistake because it did break out downward. The stock just decided to turn back up from then on.
Lesson: If a stock doesn't perform as expected, get out.
Lesson: Don't lower or remove a stop unless you have a good reason for doing so. Being afraid price might trigger the stop is exactly the wrong reason for removing it.
Southwest Airlines
Southwest Airlines (LUV) in mid‐2004 showed a similar situation. I identified a broadening pattern in the spring and bought after the throwback completed. In other words, I was late buying into the stock. Had I placed a buy stop a penny above the top horizontal line, it would have filled at 15.31 the day before the actual breakout. Instead, I bought in at 15.81, but that isn't too far off the optimal entry price.
From my trading notebook: “Mood (Will trade work? Bought too soon?): Cautious. Other airlines are moving lower, so I don't really trust this one. Long term, I think the price is a good one. Short term, who knows?
“Buy reason: Throwback from RABFD completed and oil prices are trending down. Since most of the fuel is hedged, the price won't make much difference. If it can push through the HCR [horizontal consolidation region] (flag in Dec 2003), then this has a chance of moving up.”
The stock formed a second broadening pattern and that one broke out upward, too, making a sharp rise upward (5% rise) in one day. The move looked like an earnings surprise where price shoots up and then retraces the move over the following week to 10 days. That's what happened here, except earnings came out a few weeks later.
My notes say I should have sold the day of the 5% spike and locked in a profit. Instead, I took a 3% loss when the stock returned to the price of the top of the broadening pattern, where I sold.
Lesson: When the market gives you a gift (the 5% rise), find the reason for the move and consider selling.
I don't know if that's good advice or not. In earnings surprises, it can pay to hold on for months because the announcement generates excitement and that excitement pushes the stock up (after the retrace that is). In this case, I don't know what caused the 5% rise.
Con‐way
Con‐way Inc. (CNF, now CNW) formed a broadening pattern starting in November 2003 and lasting until April 2004. Here's my notebook entry: “21 April 2004. I bought at market, filled at 37.13, 11:06 am. This is an upside breakout from a right‐angled broadening formation, descending. Measure rule says 41.14 is the target, call it 41. Downside is just below prior minor low, 34.33 for 8% loss. The truckers are doing well right now, despite wishy‐washy market and high fuel costs. The company also announced earnings that apparently were better than expected.”
I bought the day after the upward breakout. Over the next two weeks, the stock threw back, but I survived by holding on. My fingers hurt.
The stock started climbing in a measured move up type pattern (rise, retrace, rise). I raised the stop not once, nor twice, but seven times along the way to the sale.
On 12 July, the stop‐loss order took me out of the trade. From my notebook: “Mood (Sell too soon?): Good. The stop took me out and this morning [the stock] is trading even lower. Earnings are due in 5 days, so maybe the stock is signaling weak results. Time to move on as it pierced the trendline on the sell day.”
What trendline am I referring to? The only idea I have is to draw one connecting the throwback low along the bottoms as price climbed. The stock broke out of a 10‐day congestion region and pierced the up‐sloping trendline at the same time. That's when I sold.
I made 8% on the trade, but sold too soon. Yes, the stock moved sideways for almost 3 months but eventually made its way to 61.87 or 54% higher than where I sold.
For a swing trade (it wasn't supposed to be), this was a good execution. I bought the day after the breakout and sold before weakness took the stock lower and threw it sideways to down for months. For a longer term position trade (which was intended), I missed the big gain. Again.
Lesson: When position trading, allow for more volatility to capture longer‐term gains.
Sample Trade
Ralph is a pattern trader with a measure of experience milking chart patterns for all they are worth. When he noticed what he thought was either a descending broadening wedge or a right‐angled descending broadening formation, he bought the stock. His order, placed at point C in Figure 10.7(46.38), was just after the stock bounced off the lower trendline.
He monitored the stock closely and watched it move up the very next day, then ease lower.
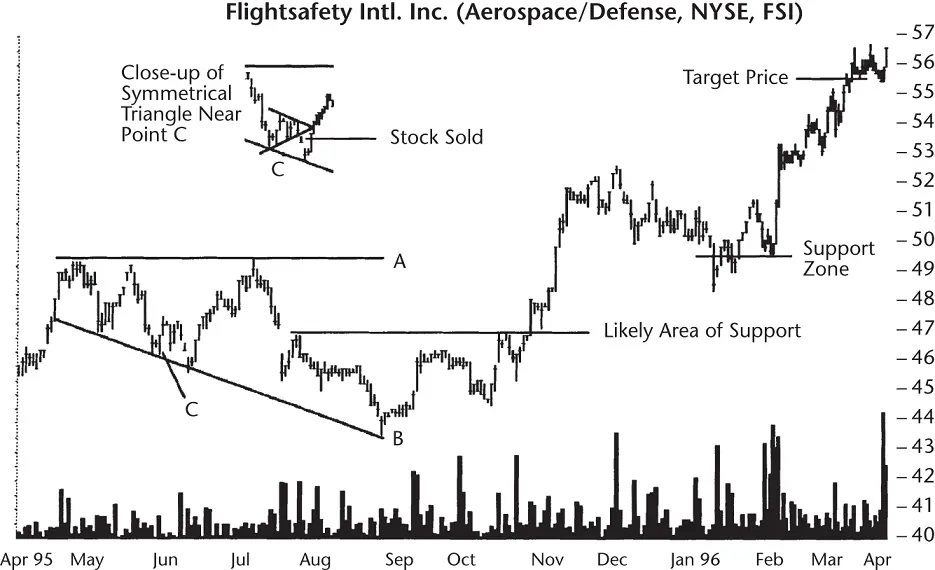
Figure 10.7This descending broadening pattern has an upward breakout. To compute the measure rule for upward breakouts, find the difference between the high and low in the formation, denoted by points A and B. Add the height to point A to get the upward breakout target price. It took almost 7 months for price to exceed the target. A small symmetrical triangle appears at point C.
Читать дальшеИнтервал:
Закладка:
Похожие книги на «Encyclopedia of Chart Patterns»
Представляем Вашему вниманию похожие книги на «Encyclopedia of Chart Patterns» списком для выбора. Мы отобрали схожую по названию и смыслу литературу в надежде предоставить читателям больше вариантов отыскать новые, интересные, ещё непрочитанные произведения.


Обсуждение, отзывы о книге «Encyclopedia of Chart Patterns» и просто собственные мнения читателей. Оставьте ваши комментарии, напишите, что Вы думаете о произведении, его смысле или главных героях. Укажите что конкретно понравилось, а что нет, и почему Вы так считаете.