Thomas N. Bulkowski - Encyclopedia of Chart Patterns
Здесь есть возможность читать онлайн «Thomas N. Bulkowski - Encyclopedia of Chart Patterns» — ознакомительный отрывок электронной книги совершенно бесплатно, а после прочтения отрывка купить полную версию. В некоторых случаях можно слушать аудио, скачать через торрент в формате fb2 и присутствует краткое содержание. Жанр: unrecognised, на английском языке. Описание произведения, (предисловие) а так же отзывы посетителей доступны на портале библиотеки ЛибКат.

- Название:Encyclopedia of Chart Patterns
- Автор:
- Жанр:
- Год:неизвестен
- ISBN:нет данных
- Рейтинг книги:3 / 5. Голосов: 1
-
Избранное:Добавить в избранное
- Отзывы:
-
Ваша оценка:
Encyclopedia of Chart Patterns: краткое содержание, описание и аннотация
Предлагаем к чтению аннотацию, описание, краткое содержание или предисловие (зависит от того, что написал сам автор книги «Encyclopedia of Chart Patterns»). Если вы не нашли необходимую информацию о книге — напишите в комментариях, мы постараемся отыскать её.
, Third Edition expands upon Bulkowski's immensely popular Second Edition with fully revised and updated material on chart patterns. Whether you’re new to the stock market or an experienced professional trader, use this book as a reference guide to give you an edge.
Within the pages of this book, you’ll learn how to identify chart patterns, supported by easy-to-understand performance statistics describing how well a pattern works, what the failure rate is, and what special quirks suggest better future performance. You’ll discover how often a stop loss order will trigger at various locations within a chart pattern, how the chart pattern’s performance has evolved over the past three decades, and how to profit from failure by trading busted patterns.
This broadened and revised
offers investors the most comprehensive, up-to-date guide to this popular method of market analysis. Written by a leading expert on chart patterns, Tom Bulkowski, this edition includes revised statistics on 75 chart patterns including 23 new ones, with pictures and performance statistics, packaged within easy-to-read text.
Gain essential knowledge of chart patterns and how they are used to predict price movements in bull and bear markets New tables include how often stops are hit, busted pattern performance, performance over the decades, and special pattern features Joining Tour, Identification Guidelines, Focus on Failures, Statistics, Trading Tactics and Sample Trade is Experience. It puts you in the passenger’s seat so you can share lessons learned from Bulkowski's trades This edition reports on statistics from nearly four times the number of samples used in the Second Edition and ten times the number in the , Third Edition further solidifies the reputation of this book as the leading reference on chart patterns, setting it far above the competition.
Encyclopedia of Chart Patterns — читать онлайн ознакомительный отрывок
Ниже представлен текст книги, разбитый по страницам. Система сохранения места последней прочитанной страницы, позволяет с удобством читать онлайн бесплатно книгу «Encyclopedia of Chart Patterns», без необходимости каждый раз заново искать на чём Вы остановились. Поставьте закладку, и сможете в любой момент перейти на страницу, на которой закончили чтение.
Интервал:
Закладка:
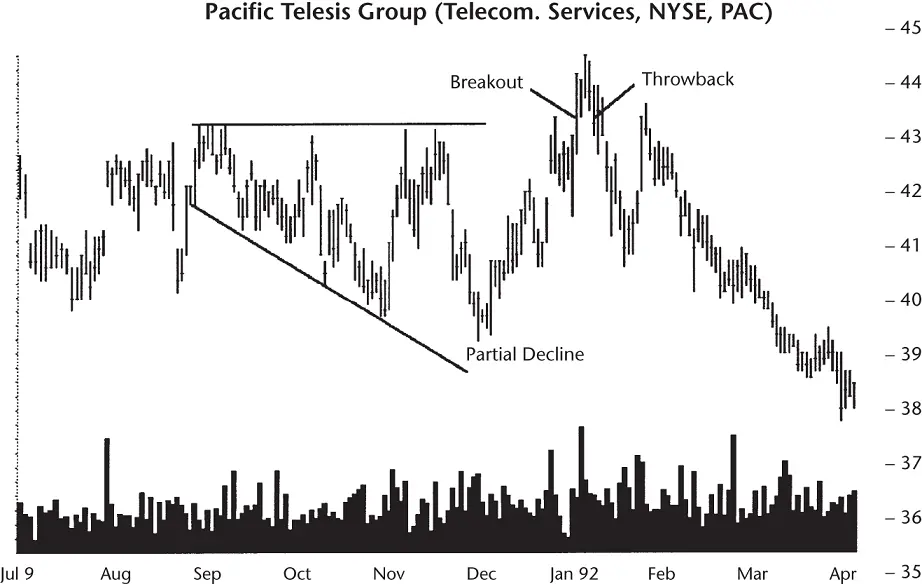
Figure 10.5 A descending broadening formation appears with price that fails to continue moving up. The partial decline suggests the ultimate breakout will be upward, but the rise falters and price moves down instead.
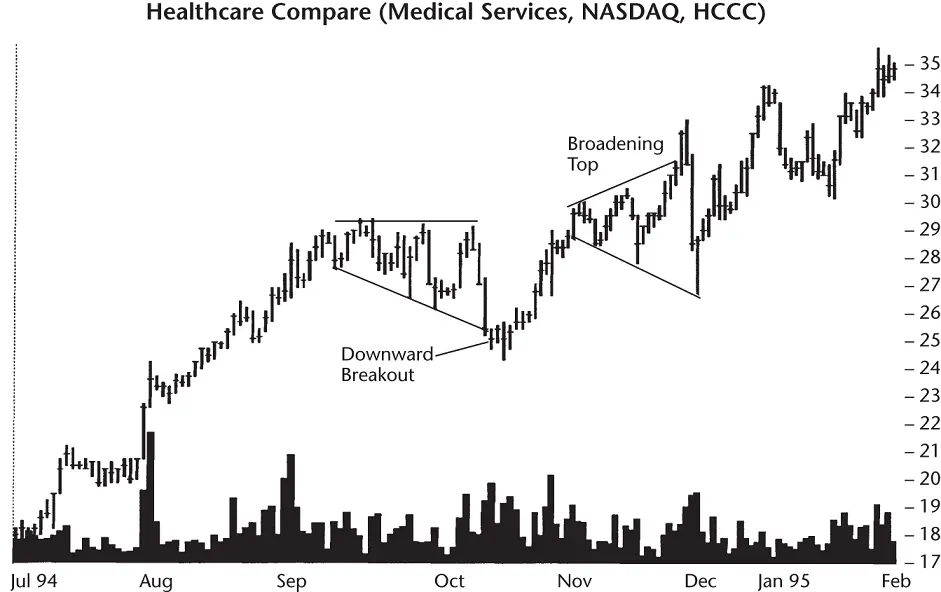
Figure 10.6 This descending broadening pattern (left) results in a 5% failure. A broadening top formed in early November.
Figure 10.6shows a more harrowing tale because it involves a short sale. Investors watching the sharp 2‐day decline beginning 14 October 1994 would be tempted to short the stock the next day. Had they done so, or even waited a few days, they would have opened the trade near the low. From that point on the stock moved higher, back into the formation before ultimately soaring out the top. If you were a novice trader and had not placed a stop on your short sale, your loss would have taken you from a low of 24.38 to 53, where it peaked near the end of the study.
The figure represents a failure type I call a 5% failure . That happens when price breaks out in a given direction and moves no more than 5% before crossing the pattern and breaking out in the new direction. This type of failure can turn a small profit into a large loss if stops are not used.
Statistics
Table 10.2shows general statistics for right‐angled and descending broadening formations.
Number found.I found 1,150 patterns in 668 stocks from August 1991 to October 2019. However, that included bear market patterns, and there were not enough of those to include in the statistics. Not all of the stocks covered the entire period, and some no longer trade. Notice that the pattern favors upward breakouts, judging only by the numbers.
Table 10.2 General Statistics
| Description | Up Breakout | Down Breakout |
|---|---|---|
| Number found | 601 | 335 |
| Reversal (R), continuation (C) occurrence | 38% R, 62% C | 58% R, 42% C |
| Reversal, continuation performance | 45% R, 41% C | –14% R, –17% C |
| Average rise or decline | 43% | –15% |
| Standard & Poor's 500 change | 12% | –2% |
| Days to ultimate high or low | 244 | 51 |
| How many change trend? | 54% | 27% |
Reversal (R), continuation (C) occurrence.Upward breakouts act as continuation patterns most often, but downward breakouts act as reversals. Recall that a reversal has price leaving the chart pattern in a direction opposite the way it entered. Continuation patterns have price exit in the same direction as the prevailing price trend.
Reversal/continuation performance.Upward breakouts show better performance from reversal patterns, but downward breakouts favor continuations.
Average rise or decline.Shown in the table is the average rise or decline. Nothing spectacular here.
Standard & Poor's 500 change.I compared the date of the breakout to the ultimate high or low posted by the chart pattern and compared those to the index. The index shows it didn't perform nearly as well as the broadening pattern over the same holding period.
Days to ultimate high or low.Upward breakouts take an average of about 8 months to reach the ultimate high, but downward breakouts end faster, in about 2 months. The yardage traveled is different, though, because upward breakouts rise 43% and downward breakouts drop 15%. If you do the math, we find that the downward breakout should have reached bottom in 85 days, not 51. So, price dropped faster than it climbed.
How many change trend?I added this measure to help decide which chart patterns lead to outsized gains (a gain or loss of more than 20%). The results shown in the table are mid‐list numbers. The upward breakout number is good (more than half the patterns see decent gains), but downward breakouts fall well short of a 20% loss (just 27% drop that far).
Table 10.3shows various failure rates for the two breakout directions. How do you make sense of the table? It is easier to understand by example. I found that 21% of the patterns with upward breakouts failed to see price rise more than 5%. Over half (51%) of the patterns failed to see price rise more than 25% after an upward breakout.
Table 10.3 Cumulative Failure Rates
| Maximum Price Rise or Decline (%) | Up Breakout | Down Breakout |
|---|---|---|
| 5 (breakeven) | 125 or 21% | 77 or 23% |
| 10 | 65 or 32% | 72 or 33% |
| 15 | 46 or 39% | 50 or 59% |
| 20 | 43 or 46% | 45 or 73% |
| 25 | 29 or 51% | 29 or 81% |
| 30 | 44 or 59% | 21 or 88% |
| 35 | 28 or 63% | 15 or 92% |
| 50 | 65 or 74% | 17 or 97% |
| 75 | 55 or 83% | 9 or 100% |
| Over 75 | 101 or 100% | 0 or 100% |
Table 10.4 Breakout and Post‐Breakout Statistics
| Description | Up Breakout | Down Breakout |
|---|---|---|
| Breakout direction | 64% up | 36% down |
| Performance of breakouts occurring near the 12‐month low (L), middle (M), or high (H) | L 46%, M 49%, H 41% | L –19%, M –14%, H –12% |
| Throwbacks/pullbacks occurrence | 64% | 69% |
| Average time to throwback/pullback peaks | 5% in 6 days | –7% in 6 days |
| Average time to throwback/pullback ends | 12 days | 12 days |
| Average rise/decline for patterns with throwbacks/pullbacks | 43% | –15% |
| Average rise/decline for patterns without throwbacks/pullbacks | 42% | –15% |
| Percentage price resumes trend | 71% | 55% |
| Performance with breakout day gap | 35% | –18% |
| Performance without breakout day gap | 44% | –15% |
| Average gap size | $0.45 | $0.37 |
You read downward breakouts in a similar manner. Almost a quarter of the patterns (23%) saw price drop no more than 5%. Half (59%) didn't see price drop more than 15%.
Table 10.4shows breakout‐related statistics.
Breakout direction.Price breaks out of the pattern upward almost twice as often as downward.
Yearly position, performance.I sorted the breakout price into one of three buckets, each a third of the yearly high–low range. Then I checked performance for patterns in those three buckets. The table shows that there's not a big performance difference for upward breakouts. Clearly, though, you'll want to avoid trading patterns within a third of the yearly high (price rises 41%).
Downward breakouts also show those near the yearly high underperforming those in the other two buckets. It suggests people should avoid momentum trading this chart pattern and focus on bottom fishing for candidates.
Throwbacks and pullbacks.Throwbacks and pullbacks occur almost two‐thirds of the time, and it takes stocks less than 2 weeks to return to the breakout price.
Читать дальшеИнтервал:
Закладка:
Похожие книги на «Encyclopedia of Chart Patterns»
Представляем Вашему вниманию похожие книги на «Encyclopedia of Chart Patterns» списком для выбора. Мы отобрали схожую по названию и смыслу литературу в надежде предоставить читателям больше вариантов отыскать новые, интересные, ещё непрочитанные произведения.


Обсуждение, отзывы о книге «Encyclopedia of Chart Patterns» и просто собственные мнения читателей. Оставьте ваши комментарии, напишите, что Вы думаете о произведении, его смысле или главных героях. Укажите что конкретно понравилось, а что нет, и почему Вы так считаете.