Thomas N. Bulkowski - Encyclopedia of Chart Patterns
Здесь есть возможность читать онлайн «Thomas N. Bulkowski - Encyclopedia of Chart Patterns» — ознакомительный отрывок электронной книги совершенно бесплатно, а после прочтения отрывка купить полную версию. В некоторых случаях можно слушать аудио, скачать через торрент в формате fb2 и присутствует краткое содержание. Жанр: unrecognised, на английском языке. Описание произведения, (предисловие) а так же отзывы посетителей доступны на портале библиотеки ЛибКат.

- Название:Encyclopedia of Chart Patterns
- Автор:
- Жанр:
- Год:неизвестен
- ISBN:нет данных
- Рейтинг книги:3 / 5. Голосов: 1
-
Избранное:Добавить в избранное
- Отзывы:
-
Ваша оценка:
Encyclopedia of Chart Patterns: краткое содержание, описание и аннотация
Предлагаем к чтению аннотацию, описание, краткое содержание или предисловие (зависит от того, что написал сам автор книги «Encyclopedia of Chart Patterns»). Если вы не нашли необходимую информацию о книге — напишите в комментариях, мы постараемся отыскать её.
, Third Edition expands upon Bulkowski's immensely popular Second Edition with fully revised and updated material on chart patterns. Whether you’re new to the stock market or an experienced professional trader, use this book as a reference guide to give you an edge.
Within the pages of this book, you’ll learn how to identify chart patterns, supported by easy-to-understand performance statistics describing how well a pattern works, what the failure rate is, and what special quirks suggest better future performance. You’ll discover how often a stop loss order will trigger at various locations within a chart pattern, how the chart pattern’s performance has evolved over the past three decades, and how to profit from failure by trading busted patterns.
This broadened and revised
offers investors the most comprehensive, up-to-date guide to this popular method of market analysis. Written by a leading expert on chart patterns, Tom Bulkowski, this edition includes revised statistics on 75 chart patterns including 23 new ones, with pictures and performance statistics, packaged within easy-to-read text.
Gain essential knowledge of chart patterns and how they are used to predict price movements in bull and bear markets New tables include how often stops are hit, busted pattern performance, performance over the decades, and special pattern features Joining Tour, Identification Guidelines, Focus on Failures, Statistics, Trading Tactics and Sample Trade is Experience. It puts you in the passenger’s seat so you can share lessons learned from Bulkowski's trades This edition reports on statistics from nearly four times the number of samples used in the Second Edition and ten times the number in the , Third Edition further solidifies the reputation of this book as the leading reference on chart patterns, setting it far above the competition.
Encyclopedia of Chart Patterns — читать онлайн ознакомительный отрывок
Ниже представлен текст книги, разбитый по страницам. Система сохранения места последней прочитанной страницы, позволяет с удобством читать онлайн бесплатно книгу «Encyclopedia of Chart Patterns», без необходимости каждый раз заново искать на чём Вы остановились. Поставьте закладку, и сможете в любой момент перейти на страницу, на которой закончили чтение.
Интервал:
Закладка:
I made 198% on the trade, including dividends. I almost tripled my money, but it took 8 years to do it. In terms of dollar profit, this was my second most profitable trade (but well down the list in percentage terms), so I put a lot of cash behind it.
Lesson: Good things can happen to people who wait.
Lesson: For a buy‐and‐hold investment, you have to be able to tolerate large price swings.
Sample Trade
Palmer sat at his computer desk. His foot hammered the carpet, and his fingers drummed the desk. It looked as if he swallowed too much caffeine. I am sure you have met the type.
Faced with the situation shown in Figure 9.5, he took swift, decisive, maybe even impulsive action. At point A, where the stock touched the top trendline, he quickly sold it short and received a fill at 33.38. He placed a stop at 34 in case the trade went against him. Then he waited.
It did not take long for the stock to cross the broadening top and reach the horizontal trendline.
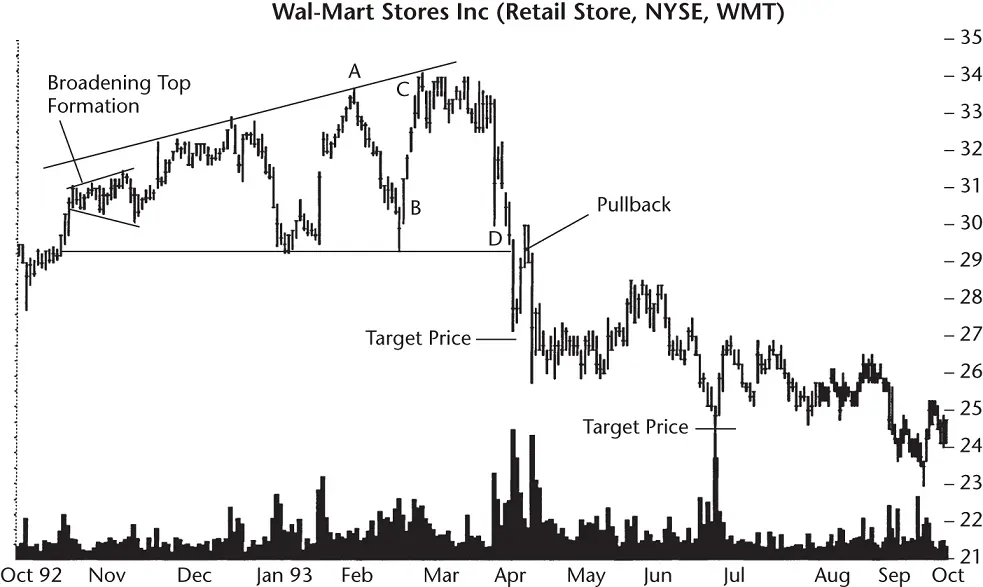
Figure 9.5Shown are price targets using half and full formation heights for the broadening top formation.
His fingers stopped moving, and he pointed at the screen. “I should have placed an order to cover my short at 29.38. That's the value of the bottom trendline. Look what happened.”
Price bounced off the low. He covered his short the following day, shown as point B, at 30.50. Immediately, he went long and bought the stock at the same price.
Palmer placed a stop‐loss order just below the horizontal trendline, at 29.25, just in case. Then he extended the top trendline. “I worried that the stock might not reach it, so I put a target below the old high at A.”
In less than a week, the stock reached his target and sold at 33.50 (point C). Since the stock was still showing an upward bias, he held off trading and waited for the trend to reverse. Three days later he sold the stock short again at 33. This time, he put a sell order above the lower trendline at 29.50.
“The stock moved against me. Made me nervous.”
I wondered what that would look like. He was already twitchy. He couldn't sit still.
The stock rose to 34 and oscillated up and down for nearly 3 weeks, never quite reaching his stop‐loss point of 34.38. Then the stock plunged and zipped across the chart pattern. It hit his target price at point D, and he covered his short.
Sensing a shift in the investment winds, he went long on the stock at the same price but put a stop‐loss order below the lower trendline. “The following day, I was stopped out at 29.25 and took a small loss.”
“Then what did you do?” I asked.
He reached for his coffee mug, found it empty, and left the office for a refill. I never did get an answer to my question.
10 Broadening Formation, Right‐Angled and Descending
RESULTS SNAPSHOT
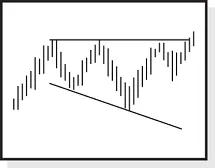
Appearance: The pattern has a horizontal top with lower lows following a down‐sloping trendline.
Upward Breakouts
| Reversal or continuation | Long‐term bullish continuation |
| Performance rank | 19 out of 39 |
| Breakeven failure rate | 21% |
| Average rise | 43% |
| Volume trend | Upward |
| Throwbacks | 64% |
| Percentage meeting price target | 65% |
Downward Breakouts
| Reversal or continuation | Short‐term bearish reversal |
| Performance rank | 18 out of 36 |
| Breakeven failure rate | 23% |
| Average drop | 15% |
| Volume trend | Upward |
| Pullbacks | 69% |
| Percentage meeting price target | 51% |
The right‐angled and descending broadening formation's name is a mouthful, but it describes a pattern with a flat top and price following a down‐sloping trend along the bottom.
The performance rank places it in the middle of the chart patterns I studied. The pattern favors an upward breakout almost twice as often as a downward one.
The above Results Snapshot shows performance about what you would expect from a mid‐list performer. Nothing appears that would blow the roof off the house. Volume trends upward throughout the pattern and that is unusual.
Let's take a scenic tour of the pattern.
Tour
What do descending broadening patterns look like, and why do they form? Figure 10.1shows an example of the chart pattern I caught back in the 1990s. There are the two key ingredients to this broadening pattern. First, price at the top of the pattern reaches the same level (or nearly the same) for several weeks. A trendline drawn atop the pattern's peaks forms a horizontal line.
Second, the minor lows touch and follow a down‐sloping trendline as price drops. Eventually, price breaks out of the pattern by closing either above the top trendline or below the bottom one.
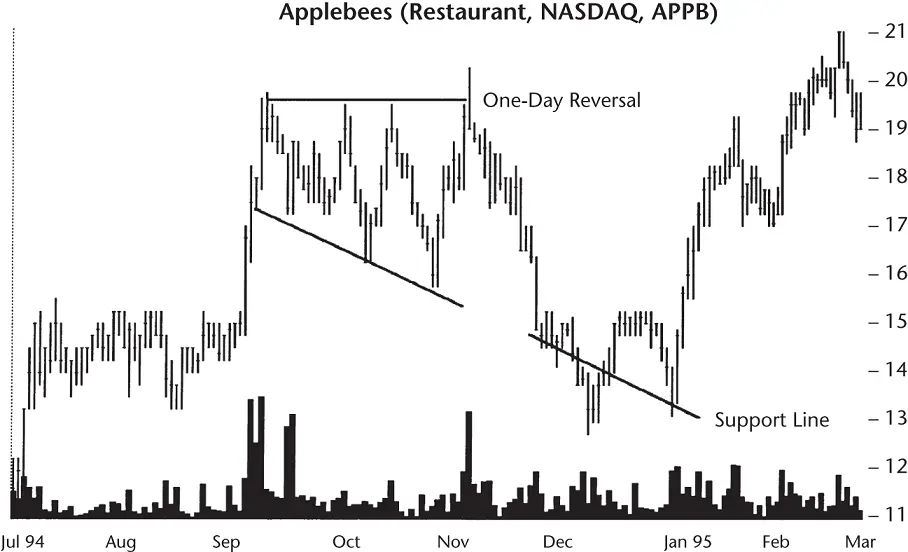
Figure 10.1 A horizontal trendline drawn along the tops, and a down‐sloping trendline connecting the minor lows, is characteristic of this chart pattern. The extended, down‐sloping trendline shows future support and resistance areas. A one‐day reversal appears on 3 November when price pushed above the formation top on high volume but closed at the low for the day.
In this example, the breakout is downward (which happens in mid‐November, the day when the second down‐sloping line begins) because price closes below the lower trendline there. I require price to close outside the trendline, so that's why the one‐day reversal on 3 November at the pattern's top doesn't qualify as an upward breakout. On that day, price closed at 19, the low for the day, and below the top trendline value of about 19.50.
Figure 10.2shows an example of the broadening pattern with an upward breakout. The top of the pattern is well formed with several minor peaks reaching the same price level. However, two one‐day touches compose the lower trendline. A trendline touch is a trendline touch regardless of whether it is composed of one‐day spikes or many days of consecutive touches, but they need to be minor lows (or minor highs), which these two are. If price cuts through a trendline, such as at the start or end of the pattern, it doesn't count as a trendline touch because it's not at a minor high or low.
The figure shows a broadening pattern with an upward breakout providing a tasty 10% rise in just over 2 weeks. A throwback to the top of the broadening pattern occurs almost 4 weeks after the breakout. I consider throwbacks or pullbacks that happen later than 30 days to be just normal price action, and not a throwback or pullback. This one just makes the cut at 27 days. Often, a throwback or pullback will return to the breakout price in an average of 12 days.
Why do these chart patterns form? Look at Figure 10.3. During 1993, the stock entered the left pattern in early April and moved higher on moderate volume until it reached about 35. There, investors selling the stock matched buyers eager to own the security, and the rise stalled. The stock traveled sideways until 10 May when it moved below the prior minor low. As the stock approached $31, it entered a support zone set up by the retracement in mid‐March. The decline stalled and moved sideways for several days. Due to the support level, many investors believed that the decline was at an end and the stock would move higher. It did. As volume climbed, price gapped up (breakaway gap) and quickly soared back to the old high.
Читать дальшеИнтервал:
Закладка:
Похожие книги на «Encyclopedia of Chart Patterns»
Представляем Вашему вниманию похожие книги на «Encyclopedia of Chart Patterns» списком для выбора. Мы отобрали схожую по названию и смыслу литературу в надежде предоставить читателям больше вариантов отыскать новые, интересные, ещё непрочитанные произведения.


Обсуждение, отзывы о книге «Encyclopedia of Chart Patterns» и просто собственные мнения читателей. Оставьте ваши комментарии, напишите, что Вы думаете о произведении, его смысле или главных героях. Укажите что конкретно понравилось, а что нет, и почему Вы так считаете.