Thomas N. Bulkowski - Encyclopedia of Chart Patterns
Здесь есть возможность читать онлайн «Thomas N. Bulkowski - Encyclopedia of Chart Patterns» — ознакомительный отрывок электронной книги совершенно бесплатно, а после прочтения отрывка купить полную версию. В некоторых случаях можно слушать аудио, скачать через торрент в формате fb2 и присутствует краткое содержание. Жанр: unrecognised, на английском языке. Описание произведения, (предисловие) а так же отзывы посетителей доступны на портале библиотеки ЛибКат.

- Название:Encyclopedia of Chart Patterns
- Автор:
- Жанр:
- Год:неизвестен
- ISBN:нет данных
- Рейтинг книги:3 / 5. Голосов: 1
-
Избранное:Добавить в избранное
- Отзывы:
-
Ваша оценка:
Encyclopedia of Chart Patterns: краткое содержание, описание и аннотация
Предлагаем к чтению аннотацию, описание, краткое содержание или предисловие (зависит от того, что написал сам автор книги «Encyclopedia of Chart Patterns»). Если вы не нашли необходимую информацию о книге — напишите в комментариях, мы постараемся отыскать её.
, Third Edition expands upon Bulkowski's immensely popular Second Edition with fully revised and updated material on chart patterns. Whether you’re new to the stock market or an experienced professional trader, use this book as a reference guide to give you an edge.
Within the pages of this book, you’ll learn how to identify chart patterns, supported by easy-to-understand performance statistics describing how well a pattern works, what the failure rate is, and what special quirks suggest better future performance. You’ll discover how often a stop loss order will trigger at various locations within a chart pattern, how the chart pattern’s performance has evolved over the past three decades, and how to profit from failure by trading busted patterns.
This broadened and revised
offers investors the most comprehensive, up-to-date guide to this popular method of market analysis. Written by a leading expert on chart patterns, Tom Bulkowski, this edition includes revised statistics on 75 chart patterns including 23 new ones, with pictures and performance statistics, packaged within easy-to-read text.
Gain essential knowledge of chart patterns and how they are used to predict price movements in bull and bear markets New tables include how often stops are hit, busted pattern performance, performance over the decades, and special pattern features Joining Tour, Identification Guidelines, Focus on Failures, Statistics, Trading Tactics and Sample Trade is Experience. It puts you in the passenger’s seat so you can share lessons learned from Bulkowski's trades This edition reports on statistics from nearly four times the number of samples used in the Second Edition and ten times the number in the , Third Edition further solidifies the reputation of this book as the leading reference on chart patterns, setting it far above the competition.
Encyclopedia of Chart Patterns — читать онлайн ознакомительный отрывок
Ниже представлен текст книги, разбитый по страницам. Система сохранения места последней прочитанной страницы, позволяет с удобством читать онлайн бесплатно книгу «Encyclopedia of Chart Patterns», без необходимости каждый раз заново искать на чём Вы остановились. Поставьте закладку, и сможете в любой момент перейти на страницу, на которой закончили чтение.
Интервал:
Закладка:
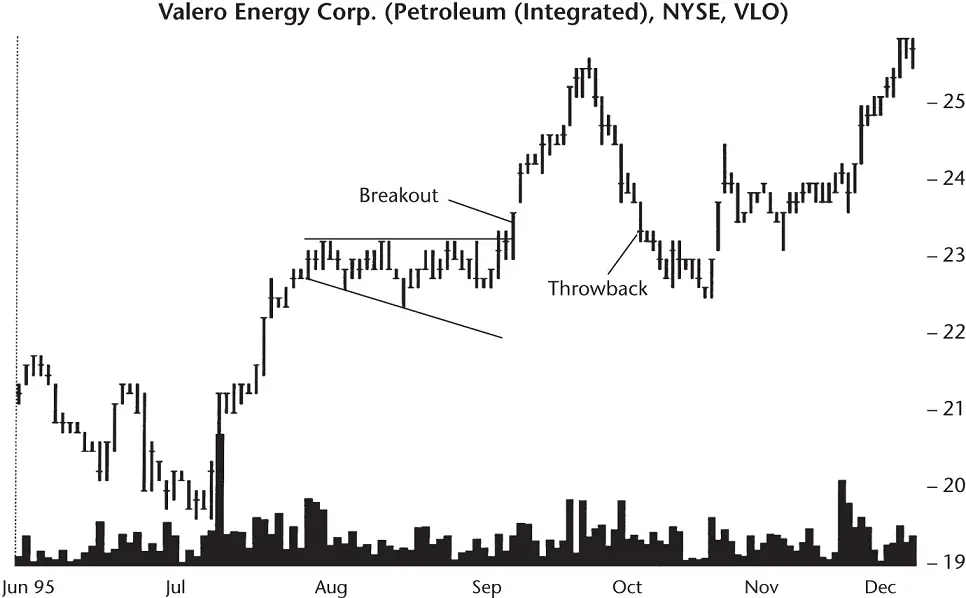
Figure 10.2 Another descending broadening formation, but this one has an upward breakout. Almost 4 weeks after the breakout, price throws back to the formation before ultimately moving higher.
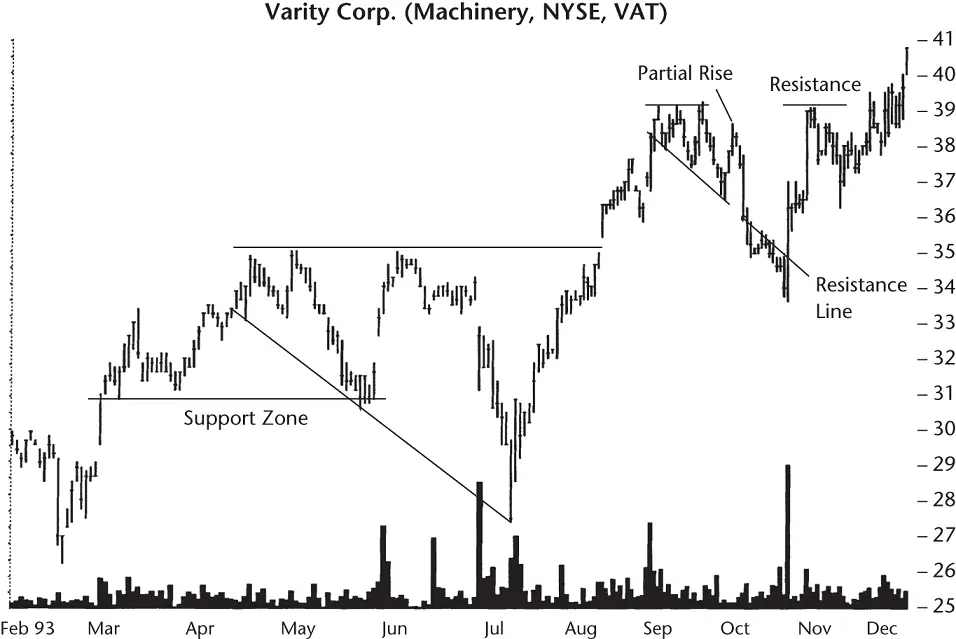
Figure 10.3 The left descending broadening pattern shows a trendline rebound resulting from earlier support. The right formation shows a partial rise that can predict a downward breakout. Shown are two resistance areas that follow the pattern's trendlines.
The stock ran into selling pressure from institutions and others trying to sell blocks of shares at a fixed price. The available supply of shares halted the advance. Price hung on for a few days, moved a bit lower, and paused before beginning a rapid decline to a new minor low.
As volume climbed, the stock declined until it touched the lower trendline, a region of support. Suspecting an oversold stock, investors bought and forced it higher again. When the stock reached the old high, there were fewer shares available for purchase. Investors and institutions who were trying to get 35 a share for their stock sold most of their shares in the preceding months. Soaking up the available supply, the stock gapped upward and closed above the old high. An upward breakout was at hand.
The stock moved higher but soon formed another descending broadening pattern (the right one, in August). This one was compact and tight but had bearish implications.
When the stock tried to reach the top trendline but could not, the partial rise foretold the coming decline. The stock plunged through the lower trending in late September and continued lower.
If you look at both chart patterns, their stories are nearly the same. There is a supply of stock available at a fixed price. After exhausting the supply, price either rises above the top trendline or declines below the bottom one. The determination on which way price will go is not clear. Sometimes supply overwhelms buying demand and the stock declines, unable to recover as the stock pierces the lower trendline. At other times, the supply tightens and enthusiastic buyers jump in and push the price higher.
Identification Guidelines
Are there some guidelines that can assist in identifying descending broadening formations? Yes, and Table 10.1outlines them.
Appearance.The shape of the broadening chart pattern looks like a megaphone with the top held horizontal. Price climbs until it touches the top trendline, and then reverses direction. On the pattern's bottom, price declines, making a series of lower lows, following a trendline downward.
Table 10.1 Identification Guidelines
| Characteristic | Discussion |
|---|---|
| Appearance | Looks like a megaphone, tilted down, with the top of the chart pattern horizontal and bounded on the bottom by a down‐sloping trendline. |
| Horizontal top resistance line | A horizontal line of resistance joins the minor highs, shown by drawing a trendline connecting the peaks. |
| Down‐sloping trendline | The expanding price series is bounded on the bottom by a down‐sloping trendline. |
| Touches | Look for at least five trendline touches, three on one trendline and two on the other. They need not be alternating touches. Price slicing through a trendline doesn't count as a touch. |
| Whitespace | Price should bounce from trendline to trendline, erasing most whitespace in the pattern. |
| Breakout direction | Price can break out in either direction, usually accompanied by a rise in volume that soon tapers off. |
| Partial rise or decline | For an established pattern, when price climbs toward the top trendline or declines toward the lower one but fails to touch it, price often reverses direction and breaks out of the broadening pattern. |
| Volume | Trends upward most often (but almost random). Don't discard a pattern with a downward volume trend. |
| Support and resistance | Follows the two trendlines into the future but is sporadic. |
Horizontal top resistance line.When two (preferably more) minor highs achieve the same, or nearly the same price, you can draw a horizontal trendline connecting them, forming the top of the pattern.
Down‐sloping trendline.The same applies to the down‐sloping trendline: It requires at least two distinct touches before drawing the trendline (more touches are better).
Touches.I prefer to see at least five trendline touches, three on one trendline and two on the other, with all five being minor highs or minor lows (peaks or valleys). Fewer than five touches make correct identification more difficult.
Whitespace. Figure 10.4shows an identification problem at AB. There are two trendline touches along the top (as minor highs) and four touches as minor lows along the bottom. The pattern looks like a descending broadening pattern.
It's not.
See that chunk of whitespace at B? Price doesn't cross the pattern often enough to qualify it as a valid broadening pattern. The inset at C shows that the pattern is better drawn as a down‐sloping channel. This chart is an example of cutting off a turn and calling it a descending broadening pattern. Do not tell anyone that you found a broadening pattern after you cut off a turn. What you found was a mistake.
Breakout direction.A breakout occurs when price closes outside the trendline boundary. Breakouts can occur in either direction.
Partial rise or decline.A partial rise, as shown in Figure 10.3, or a partial decline (not shown), is often a clue to the ultimate breakout direction. When price curls around on a partial rise or decline and returns to the trendline, the stock will usually break out immediately (that is, without crossing the chart pattern again).
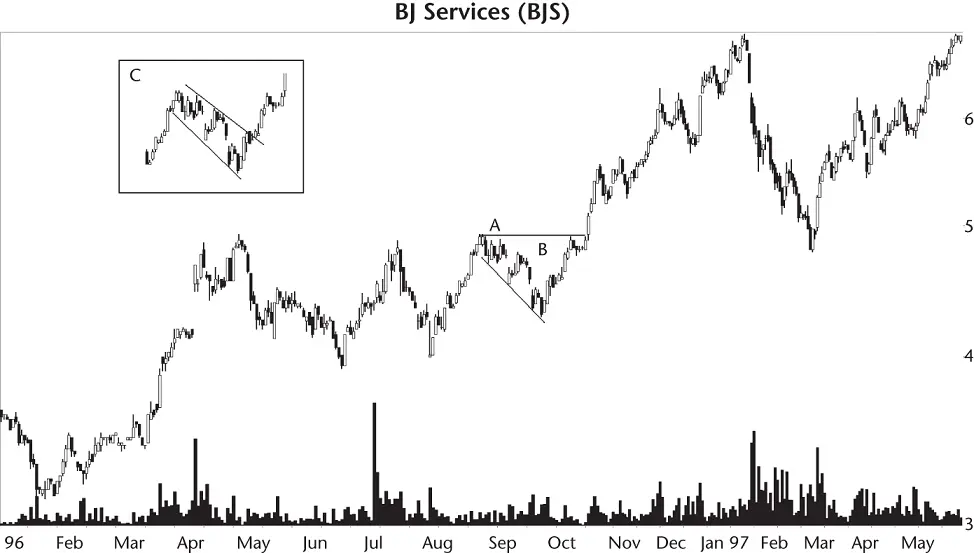
Figure 10.4 AB is not a descending broadening formation.
Volume.Volume tends to rise over the length of the chart pattern, sometimes following the price movement.
Support and resistance.The pattern's trendlines, when extended into the future, can sometimes act as areas of support or resistance. Figures 10.1, 10.3, and 10.7show examples. Sometimes the support or resistance level is active for months or even years.
Focus on Failures
Since descending broadening formations can break out either up or down, I show both views of failed breakouts. The first one, Figure 10.5, is characterized by the telltale partial decline in late November. From there, the stock climbs and eventually pierces the top trendline, as predicted.
Once price closes above the trendline, you would expect it to throw back to the formation top and resume the upward trend. In this situation, price reverses at 45 and returns to the formation proper—a classic throwback. Unfortunately, instead of rebounding and heading higher like a typical throwback, the stock continues down. It does more work inside the chart pattern before shooting out the other side in a straight‐line run.
Had you bought this stock after the upward breakout, you would have seen the stock decline from a purchase point of about 44.50 to a low of 36.88. A stop‐loss order placed at the bottom of the chart pattern would have gotten you out at 39, still a hefty decline. However, if you'd held onto the stock (not recommended, by the way), it would have been rewarding. The low occurred on 8 April (not shown), and it turned out to be the lowest price reached during the next 2 years. The stock hit its peak in early November 1993 at a price near 60.
Читать дальшеИнтервал:
Закладка:
Похожие книги на «Encyclopedia of Chart Patterns»
Представляем Вашему вниманию похожие книги на «Encyclopedia of Chart Patterns» списком для выбора. Мы отобрали схожую по названию и смыслу литературу в надежде предоставить читателям больше вариантов отыскать новые, интересные, ещё непрочитанные произведения.


Обсуждение, отзывы о книге «Encyclopedia of Chart Patterns» и просто собственные мнения читателей. Оставьте ваши комментарии, напишите, что Вы думаете о произведении, его смысле или главных героях. Укажите что конкретно понравилось, а что нет, и почему Вы так считаете.