Thomas N. Bulkowski - Encyclopedia of Chart Patterns
Здесь есть возможность читать онлайн «Thomas N. Bulkowski - Encyclopedia of Chart Patterns» — ознакомительный отрывок электронной книги совершенно бесплатно, а после прочтения отрывка купить полную версию. В некоторых случаях можно слушать аудио, скачать через торрент в формате fb2 и присутствует краткое содержание. Жанр: unrecognised, на английском языке. Описание произведения, (предисловие) а так же отзывы посетителей доступны на портале библиотеки ЛибКат.

- Название:Encyclopedia of Chart Patterns
- Автор:
- Жанр:
- Год:неизвестен
- ISBN:нет данных
- Рейтинг книги:3 / 5. Голосов: 1
-
Избранное:Добавить в избранное
- Отзывы:
-
Ваша оценка:
Encyclopedia of Chart Patterns: краткое содержание, описание и аннотация
Предлагаем к чтению аннотацию, описание, краткое содержание или предисловие (зависит от того, что написал сам автор книги «Encyclopedia of Chart Patterns»). Если вы не нашли необходимую информацию о книге — напишите в комментариях, мы постараемся отыскать её.
, Third Edition expands upon Bulkowski's immensely popular Second Edition with fully revised and updated material on chart patterns. Whether you’re new to the stock market or an experienced professional trader, use this book as a reference guide to give you an edge.
Within the pages of this book, you’ll learn how to identify chart patterns, supported by easy-to-understand performance statistics describing how well a pattern works, what the failure rate is, and what special quirks suggest better future performance. You’ll discover how often a stop loss order will trigger at various locations within a chart pattern, how the chart pattern’s performance has evolved over the past three decades, and how to profit from failure by trading busted patterns.
This broadened and revised
offers investors the most comprehensive, up-to-date guide to this popular method of market analysis. Written by a leading expert on chart patterns, Tom Bulkowski, this edition includes revised statistics on 75 chart patterns including 23 new ones, with pictures and performance statistics, packaged within easy-to-read text.
Gain essential knowledge of chart patterns and how they are used to predict price movements in bull and bear markets New tables include how often stops are hit, busted pattern performance, performance over the decades, and special pattern features Joining Tour, Identification Guidelines, Focus on Failures, Statistics, Trading Tactics and Sample Trade is Experience. It puts you in the passenger’s seat so you can share lessons learned from Bulkowski's trades This edition reports on statistics from nearly four times the number of samples used in the Second Edition and ten times the number in the , Third Edition further solidifies the reputation of this book as the leading reference on chart patterns, setting it far above the competition.
Encyclopedia of Chart Patterns — читать онлайн ознакомительный отрывок
Ниже представлен текст книги, разбитый по страницам. Система сохранения места последней прочитанной страницы, позволяет с удобством читать онлайн бесплатно книгу «Encyclopedia of Chart Patterns», без необходимости каждый раз заново искать на чём Вы остановились. Поставьте закладку, и сможете в любой момент перейти на страницу, на которой закончили чтение.
Интервал:
Закладка:
Contrast the behavior shown in Figure 11.3with that shown in Figure 11.4. I include this chart because I have noticed that a large number of broadening formations act this way. Instead of making a clear up or down thrust that pierces the trendline, price moves horizontally for months before finally closing above or below the formation highs or lows.
In this case, price declined below the low in early July and halted (the last trendline touch at pattern's end). Price climbed for a bit then receded again and reached a new low in early August. It looks as if price vaulted over the August volume spike.
Another recovery saw price rise no higher than 44 for about half a year before finally staging an upward breakout. The breakout happened when price closed above the top of the chart pattern. The sideways move isn't a 5% failure, but it tries the patience of traders waiting for something to happen.
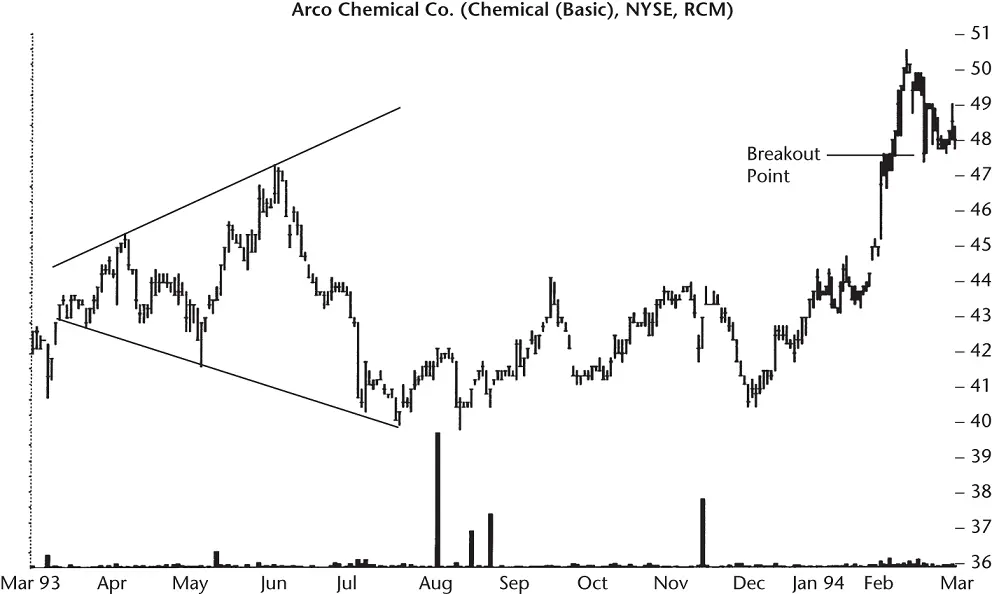
Figure 11.4 Price in this broadening top moved horizontally for 6 months before staging an upward breakout. This horizontal movement is a common occurrence with broadening tops.
Table 11.2 General Statistics
| Description | Bull Market, Up Breakout | Bear Market, Up Breakout | Bull Market, Down Breakout | Bear Market, Down Breakout |
|---|---|---|---|---|
| Number found | 1,215 | 200 | 804 | 205 |
| Reversal (R), continuation (C) occurrence | 100% C | 100% C | 100% R | 100% R |
| Average rise or decline | 42% | 25% | –13% | –22% |
| Standard & Poor's 500 change | 12% | –1% | –2% | –11% |
| Days to ultimate high or low | 253 | 91 | 56 | 37 |
| How many change trend? | 52% | 41% | 23% | 45% |
Statistics
Table 11.2shows general statistics for this chart pattern.
Number found.I uncovered 2,424 broadening tops in data from July 1991 to November 2019 in 873 stocks. Not all stocks covered the entire time, and some of them no longer trade.
Reversal (R), continuation (C) occurrence.By definition, since we are dealing with a top, an upward breakout is a continuation and a downward breakout means a reversal of the prevailing upward trend.
Average rise or decline.I compared the average rise or decline with the average for all chart pattern types and found that the broadening top underperforms in all market conditions (bull/bear) and breakout directions, despite what you see in the table.
Standard & Poor's 500 change.Notice how the general market helped or hindered price. The numbers, when compared to the average rise or decline, suggest trading with the market trend (bull market, upward breakouts and bear market, downward breakouts) for the best performance. This makes intuitive sense.
Days to ultimate high or low.The time it takes price to rise to the ultimate high or sink to the ultimate low varies from 253 days (about 8.5 months) to 37 (5 weeks).
I compared the average speed of price for upward versus downward breakouts in bull markets. The decline should have taken 79 days, but the average is 56 as shown in the table. Thus, price drops faster than it rises. In this case, it's not quite twice as fast (which is what I've seen in other chart pattern types).
Comparing the two bear market columns, we see price rise 25% in 91 days and drop 22% in 37 days. If price dropped as fast as it climbed, it should have taken 80 days to drop 22%. In this case, price drops more than twice as fast in bear markets as it rises.
How many change trend?This is a measure of how many broadening tops see price move more than 20% away from the breakout price. I like to see values above 50%, but only one of the columns qualifies.
Table 11.3shows failure rates for broadening tops. I found that 18% of broadening tops in bull markets after upward breakouts fail to see price rise more than 5%. That's how you read the table.
Here's another example. Just over half (52%) of patterns in bull markets with downward breakouts fail to see price drop more than 10%. Notice how quickly failure rates increase.
Bear markets with downward breakouts have the lowest failure rate initially, 9%, but the edge over bull markets with up breakouts does not last long. For moves of 15% and higher, bull markets with upward breakouts maintain a lower failure rate.
How is this information useful? Imagine that the measure rule predicts price will climb from 40 to 50, a 10‐point rise. That's a move of 25%. How many broadening tops in bull markets, on average, will see price rise more than 25%? Answer: 46%. To put it another way, 54% of them will fail to see price rise more than 25%.
Table 11.4shows breakout‐related statistics for broadening tops.
Breakout direction.In bull markets, price breaks out upward most often. In bear markets, the breakout direction is random.
Table 11.3 Cumulative Failure Rates
| Maximum Price Rise or Decline (%) | Bull Market, Up Breakout | Bear Market, Up Breakout | Bull Market, Down Breakout | Bear Market, Down Breakout |
|---|---|---|---|---|
| 5 (breakeven) | 219 or 18% | 35 or 18% | 219 or 27% | 19 or 9% |
| 10 | 160 or 31% | 31 or 33% | 196 or 52% | 30 or 24% |
| 15 | 119 or 41% | 24 or 45% | 125 or 67% | 39 or 43% |
| 20 | 81 or 48% | 28 or 59% | 83 or 77% | 25 or 55% |
| 25 | 78 or 54% | 22 or 70% | 60 or 85% | 27 or 68% |
| 30 | 62 or 59% | 10 or 75% | 40 or 90% | 16 or 76% |
| 35 | 62 or 64% | 9 or 80% | 26 or 93% | 13 or 82% |
| 50 | 121 or 74% | 19 or 89% | 45 or 99% | 28 or 96% |
| 75 | 122 or 84% | 10 or 94% | 9 or 100% | 5 or 99% |
| Over 75 | 191 or 100% | 12 or 100% | 1 or 100% | 3 or 100% |
Yearly position, performance.I sorted the breakout price into one of three bins. Upward breakouts show the best performance when the breakout price appears in the middle third of the yearly high–low price range. Downward breakouts favor the lowest third of the range.
Throwbacks and pullbacks.A throwback or pullback occurs about two‐thirds of the time, and it takes 11 or 12 days to complete the trip back to the breakout price (on average).
In all cases, when a throwback or pullback occurs, performance suffers. To avoid a throwback or pullback, look for nearby support or resistance that is strong enough to turn price back. Good luck with that. I've not been able to predict whether a throwback or pullback will happen. I just assume they will and go from there. If they don't appear, I'm as happy as a kid with a bag full of candy on Halloween.
You might try looking for overhead resistance or underlying support within 5% to 11% away from the pattern (those percentages are averages of how far price travels in 6 days, according to the table).
Gaps.Sometimes a breakout day gap helps and sometimes not. Downward breakouts have results that are one percentage point apart, so they may not be statistically significant. Upward breakouts see better performance if a gap is absent. That's counter to normal trading wisdom. Other chart patterns see performance improve if a gap occurs.
Читать дальшеИнтервал:
Закладка:
Похожие книги на «Encyclopedia of Chart Patterns»
Представляем Вашему вниманию похожие книги на «Encyclopedia of Chart Patterns» списком для выбора. Мы отобрали схожую по названию и смыслу литературу в надежде предоставить читателям больше вариантов отыскать новые, интересные, ещё непрочитанные произведения.


Обсуждение, отзывы о книге «Encyclopedia of Chart Patterns» и просто собственные мнения читателей. Оставьте ваши комментарии, напишите, что Вы думаете о произведении, его смысле или главных героях. Укажите что конкретно понравилось, а что нет, и почему Вы так считаете.