Thomas N. Bulkowski - Encyclopedia of Chart Patterns
Здесь есть возможность читать онлайн «Thomas N. Bulkowski - Encyclopedia of Chart Patterns» — ознакомительный отрывок электронной книги совершенно бесплатно, а после прочтения отрывка купить полную версию. В некоторых случаях можно слушать аудио, скачать через торрент в формате fb2 и присутствует краткое содержание. Жанр: unrecognised, на английском языке. Описание произведения, (предисловие) а так же отзывы посетителей доступны на портале библиотеки ЛибКат.

- Название:Encyclopedia of Chart Patterns
- Автор:
- Жанр:
- Год:неизвестен
- ISBN:нет данных
- Рейтинг книги:3 / 5. Голосов: 1
-
Избранное:Добавить в избранное
- Отзывы:
-
Ваша оценка:
Encyclopedia of Chart Patterns: краткое содержание, описание и аннотация
Предлагаем к чтению аннотацию, описание, краткое содержание или предисловие (зависит от того, что написал сам автор книги «Encyclopedia of Chart Patterns»). Если вы не нашли необходимую информацию о книге — напишите в комментариях, мы постараемся отыскать её.
, Third Edition expands upon Bulkowski's immensely popular Second Edition with fully revised and updated material on chart patterns. Whether you’re new to the stock market or an experienced professional trader, use this book as a reference guide to give you an edge.
Within the pages of this book, you’ll learn how to identify chart patterns, supported by easy-to-understand performance statistics describing how well a pattern works, what the failure rate is, and what special quirks suggest better future performance. You’ll discover how often a stop loss order will trigger at various locations within a chart pattern, how the chart pattern’s performance has evolved over the past three decades, and how to profit from failure by trading busted patterns.
This broadened and revised
offers investors the most comprehensive, up-to-date guide to this popular method of market analysis. Written by a leading expert on chart patterns, Tom Bulkowski, this edition includes revised statistics on 75 chart patterns including 23 new ones, with pictures and performance statistics, packaged within easy-to-read text.
Gain essential knowledge of chart patterns and how they are used to predict price movements in bull and bear markets New tables include how often stops are hit, busted pattern performance, performance over the decades, and special pattern features Joining Tour, Identification Guidelines, Focus on Failures, Statistics, Trading Tactics and Sample Trade is Experience. It puts you in the passenger’s seat so you can share lessons learned from Bulkowski's trades This edition reports on statistics from nearly four times the number of samples used in the Second Edition and ten times the number in the , Third Edition further solidifies the reputation of this book as the leading reference on chart patterns, setting it far above the competition.
Encyclopedia of Chart Patterns — читать онлайн ознакомительный отрывок
Ниже представлен текст книги, разбитый по страницам. Система сохранения места последней прочитанной страницы, позволяет с удобством читать онлайн бесплатно книгу «Encyclopedia of Chart Patterns», без необходимости каждый раз заново искать на чём Вы остановились. Поставьте закладку, и сможете в любой момент перейти на страницу, на которой закончили чтение.
Интервал:
Закладка:
Some investors—seeing the stock decline below their purchase price and still believing that the stock had value—bought more. That behavior also helped turn the stock around at the lows and probably explained their heightened nervousness at the top. They wanted to keep their gains this time instead of watching them evaporate should the stock decline again.
The broadening top shown in the figure also makes evident that identifying the ultimate breakout is difficult. It appears that each new high or new low may be the final push to freedom. Only when price moves in the opposite direction is it clear that price will not break out. We explore ways to profit from that behavior in the Trading Tactics section.
Identification Guidelines
Table 11.1shows the identification guidelines for the broadening top.
Appearance.The pattern looks like a megaphone with price peaks and valleys bounded by two diverging trendlines. The top trendline slopes upward, and the bottom one slopes downward.
Price trend.The price trend leading to the start of the pattern is what differentiates a broadening top from a broadening bottom. For broadening tops, the price trend should be upward, leading to the chart pattern, not downward as in the broadening bottom. This is just an arbitrary designation I have chosen to distinguish tops from bottoms (in all chart pattern types).
Trendlines.Trendlines drawn across the peaks and valleys resemble a megaphone. Higher highs and lower lows make the formation obvious to those versed in spotting chart patterns. The slope of the trendlines is what distinguishes this chart pattern from others. The top trendline must slope up and the bottom one must slope down. When one of the two trendlines is horizontal or nearly so, the formation becomes a right‐angled ascending or descending broadening formation. When the two trendlines slope in the same direction, the formation is a broadening wedge.
Table 11.1 Identification Guidelines
| Characteristic | Discussion |
|---|---|
| Appearance | Megaphone shape with higher highs and lower lows. Five‐point reversals have three peaks and two troughs. |
| Price trend | The price trend leading to the formation should be up. Ignore any overshoot or undershoot within 2 weeks of the pattern's start. |
| Trendlines | Price is bounded by two trendlines: The top one slopes upward, and the bottom one slopes downward. |
| Touches | Should have at least five touches, three on one trendline and two on the other, but not necessarily alternating touches. Price passing through a trendline doesn't count as a touch. |
| Volume | Trends upward most often. Do not discard a pattern because of an adverse volume trend. |
| Breakout direction | The breakout can occur in either direction and, in several cases, price moves horizontally for several months before staging a definitive breakout. |
Touches.There should be at least five touches of the trendlines: two on one trendline and three on the other, but be flexible. Five (or more) minor high or minor low touches makes for a well‐formed pattern. Fewer touches than five often leads to incorrectly identified patterns.
Avoid counting it as a touch when price slices through a trendline (no minor high or low involved). That's common at the start and end of the broadening pattern. Figure 11.3shows an example of this on both ends of the bottom trendline. The trendline cuts through price and does not rest on a minor low, so it doesn't count as a touch.
Page back to Figure 11.1. It shows three minor highs touching the top trendline and four minor lows either nearing or touching the bottom trendline. The minor highs and minor lows need not alternate as price crisscrosses the broadening pattern (but usually do).
Volume.Linear regression on volume shows it trending up most often. Many times, the volume pattern mimics the price pattern: rising and falling along with price, but the overall trend will be upward. Many times, you can tell the volume trend by dividing the pattern in half and estimating which half has higher volume.
Breakout direction.A breakout happens when price closes outside one of the trendline boundaries or follows a trendline for an extended time. In the figure, if you extend the top trendline upward, it will intersect price at about 58. That's a long time to wait for a breakout.
When a breakout occurs, I consider the actual breakout price to be the value of the highest peak in the pattern. In the figure, for example, the breakout price is 55.50, or the high at the one‐day reversal. Determining the breakout price is one of the challenges of trading a broadening top.
For an example of how to apply the various guidelines, consider the broadening top shown in Figure 11.2. At first glance, it looks like a large megaphone with price trends that generally follow two sloping trendlines. The top trendline slopes upward and the bottom one slopes downward, each intersecting the minor highs or lows at least twice, totaling at least five touches.
Price forms higher highs and lower lows until it breaks out of the chart pattern, closing beyond the line of trend or below turn 5.
The volume pattern generally rises as price moves up and recedes as price moves down. The figure shows this quite clearly. During the rise in mid‐November, for example, volume jumped upward as price peaked, then just as quickly receded as price declined.
Figure 11.3shows a U‐shaped volume trend. Volume is higher in September and December, and lower in the intervening months.
Orthodox broadening tops and five‐point reversals describe the same type of pattern. They are simply broadening tops that have three minor highs and two minor lows. Figure 11.3, for example, falls into this category. Other than the name, I found no substantial difference between broadening tops, orthodox broadening tops, and five‐point reversals.
Some analysts say five‐point reversals are bearish indicators, and that the formation predicts a downward breakout. A study of the pattern, admittedly using only 30 samples, suggests this is untrue. Sixteen break out upward and the others (14, but check my math) break out downward. However, the sample size is too small to make a definitive statement.
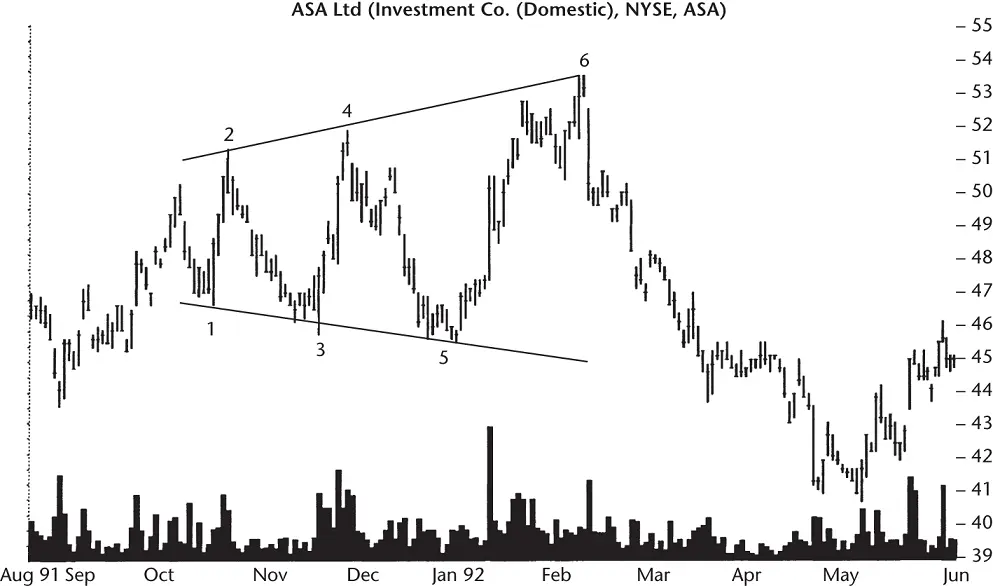
Figure 11.2 The broadening top has higher highs and lower lows as the price swings widen over time.
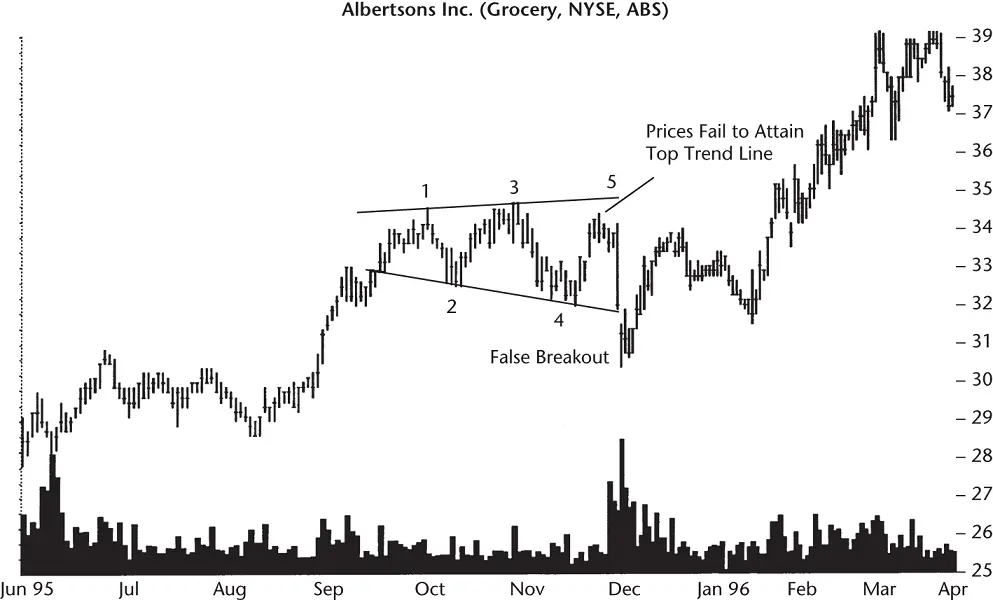
Figure 11.3A weak example of a five‐point reversal or orthodox broadening top. It has three minor highs and two minor lows composing the five turning points.
Focus on Failures
What does a broadening top failure look like? Figure 11.3shows a sharp downward breakout day thrust that pierces the bottom trendline on high volume. Since this is clearly below the lower trendline, and coupled with the failure of price to attain the upper trendline (a partial rise), a downward breakout is at hand.
The downward plunge is like a mountain climber hitting a ledge. Price stalls on very high volume, recovers, and starts climbing again. This is an example of a 5% failure; that is, price breaks out and then moves no more than 5% in the direction of the breakout before moving substantially in the other direction.
Читать дальшеИнтервал:
Закладка:
Похожие книги на «Encyclopedia of Chart Patterns»
Представляем Вашему вниманию похожие книги на «Encyclopedia of Chart Patterns» списком для выбора. Мы отобрали схожую по названию и смыслу литературу в надежде предоставить читателям больше вариантов отыскать новые, интересные, ещё непрочитанные произведения.


Обсуждение, отзывы о книге «Encyclopedia of Chart Patterns» и просто собственные мнения читателей. Оставьте ваши комментарии, напишите, что Вы думаете о произведении, его смысле или главных героях. Укажите что конкретно понравилось, а что нет, и почему Вы так считаете.