Thomas N. Bulkowski - Encyclopedia of Chart Patterns
Здесь есть возможность читать онлайн «Thomas N. Bulkowski - Encyclopedia of Chart Patterns» — ознакомительный отрывок электронной книги совершенно бесплатно, а после прочтения отрывка купить полную версию. В некоторых случаях можно слушать аудио, скачать через торрент в формате fb2 и присутствует краткое содержание. Жанр: unrecognised, на английском языке. Описание произведения, (предисловие) а так же отзывы посетителей доступны на портале библиотеки ЛибКат.

- Название:Encyclopedia of Chart Patterns
- Автор:
- Жанр:
- Год:неизвестен
- ISBN:нет данных
- Рейтинг книги:3 / 5. Голосов: 1
-
Избранное:Добавить в избранное
- Отзывы:
-
Ваша оценка:
Encyclopedia of Chart Patterns: краткое содержание, описание и аннотация
Предлагаем к чтению аннотацию, описание, краткое содержание или предисловие (зависит от того, что написал сам автор книги «Encyclopedia of Chart Patterns»). Если вы не нашли необходимую информацию о книге — напишите в комментариях, мы постараемся отыскать её.
, Third Edition expands upon Bulkowski's immensely popular Second Edition with fully revised and updated material on chart patterns. Whether you’re new to the stock market or an experienced professional trader, use this book as a reference guide to give you an edge.
Within the pages of this book, you’ll learn how to identify chart patterns, supported by easy-to-understand performance statistics describing how well a pattern works, what the failure rate is, and what special quirks suggest better future performance. You’ll discover how often a stop loss order will trigger at various locations within a chart pattern, how the chart pattern’s performance has evolved over the past three decades, and how to profit from failure by trading busted patterns.
This broadened and revised
offers investors the most comprehensive, up-to-date guide to this popular method of market analysis. Written by a leading expert on chart patterns, Tom Bulkowski, this edition includes revised statistics on 75 chart patterns including 23 new ones, with pictures and performance statistics, packaged within easy-to-read text.
Gain essential knowledge of chart patterns and how they are used to predict price movements in bull and bear markets New tables include how often stops are hit, busted pattern performance, performance over the decades, and special pattern features Joining Tour, Identification Guidelines, Focus on Failures, Statistics, Trading Tactics and Sample Trade is Experience. It puts you in the passenger’s seat so you can share lessons learned from Bulkowski's trades This edition reports on statistics from nearly four times the number of samples used in the Second Edition and ten times the number in the , Third Edition further solidifies the reputation of this book as the leading reference on chart patterns, setting it far above the competition.
Encyclopedia of Chart Patterns — читать онлайн ознакомительный отрывок
Ниже представлен текст книги, разбитый по страницам. Система сохранения места последней прочитанной страницы, позволяет с удобством читать онлайн бесплатно книгу «Encyclopedia of Chart Patterns», без необходимости каждый раз заново искать на чём Вы остановились. Поставьте закладку, и сможете в любой момент перейти на страницу, на которой закончили чтение.
Интервал:
Закладка:
Let's take a closer look at this pattern to discover what this mysterious point D is and what the pattern looks like.
Tour
The bearish AB=CD is a Fibonacci based pattern, meaning Fibonacci ratios determine the turning points.
Figure 2.1shows an example of a bearish AB=CD pattern. The pattern appears as turns ABCD on the chart. In this example, leg AB's height is similar to the height of CD, hence the name of the pattern. In the ideal case, you'll see leg CD equal AB. Often, however, the CD leg may be a Fibonacci extension away (meaning point D can be far away from the other three turns). That's not a flaw. Rather, that's just the way the pattern is constructed.
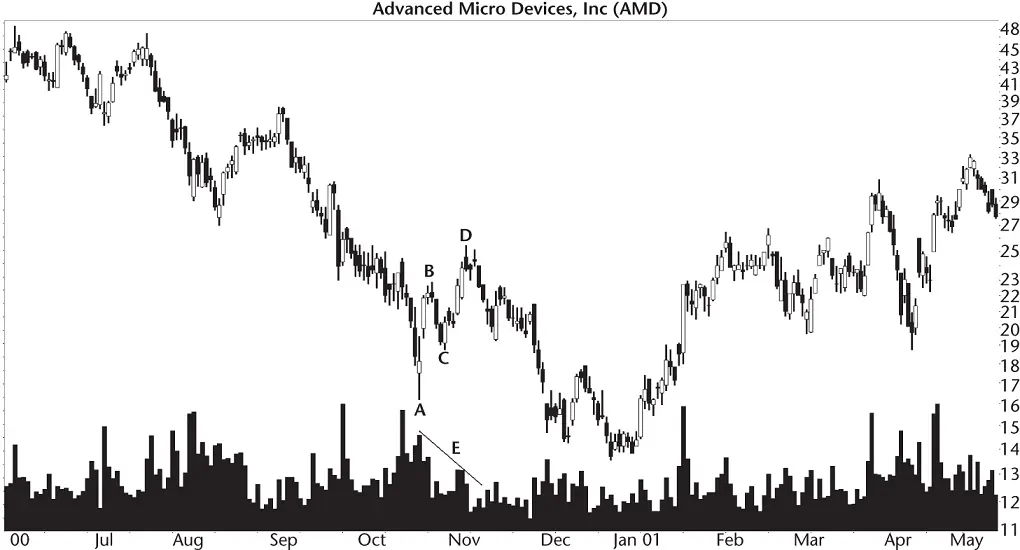
Figure 2.1 A bearish AB=CD pattern correctly predicts a downward move in the stock after turn D.
The duration (days) of AB should also equal the CD duration in the ideal case. Here we see leg AB lasting 6 calendar days and CD lasting 8. That's quite close, isn't it? Most of the time, like I described for price, point D's date can be far removed from the other points.
In well‐behaved patterns of this type, the slope of the AB line should be similar to the CD slope, with a retrace in between. That's almost what you see in Figure 2.1, but it's seldom that pretty. In fact, you can see some bizarre‐looking AB=CD patterns even though they qualify as valid Fibonacci patterns.
Volume trends downward in this example, shown on the chart as E.
This ABCD is a good performer. Price completes a tidy and compact‐looking pattern and then price falls, making an extended decline into December. That's how the pattern is supposed to behave.
Let's go through the guidelines for identifying these patterns.
Identification Guidelines
Table 2.1shows identification guidelines for the chart pattern, and Figure 2.2shows a typical example. The pattern appears in the figure as ABCD.
Appearance.As I mentioned, the shape of the bearish AB=CD can look weird when point D is far from the ABC turns. The figure is an example of that asymmetry, but not an extreme one. Leg AB is 36 days long, so you might expect (or hope) the CD move to also be that long. It's not. CD is 66 days long or almost twice the AB duration. It'll be rare that leg CD matches the length of AB. Just because CD is almost twice as far away as AB doesn't mean the pattern is invalid. Rather, the turn is determined by the Fibonacci number used to located it.
Table 2.1 Identification Guidelines
| Characteristic | Discussion |
|---|---|
| Appearance | A three‐leg zigzag pattern with two turns located by Fibonacci ratios. |
| BC/BA retrace | The ratio of BC/BA is one of .382, .5, .618, .707, .786, or .886. |
| DC/BC extension | The extension of leg DC to BC is one of the Fibonacci numbers: 1.13, 1.27, 1.41, 1.618, 2, 2.24, 2.618, or 3.14. |
| Hills and valleys | From A to B, there should be no valley lower than A and no peak higher than B. From B to C, there should be peak higher than B and no valley lower than C. From C to D, there should be no valley lower than C and no peak higher than D. |
| Volume | Trends downward most often. Don't ignore a pattern because of an unusual volume trend. |
| Duration | I limited patterns to 6 months, but this is an arbitrary limit I use for most chart patterns. |
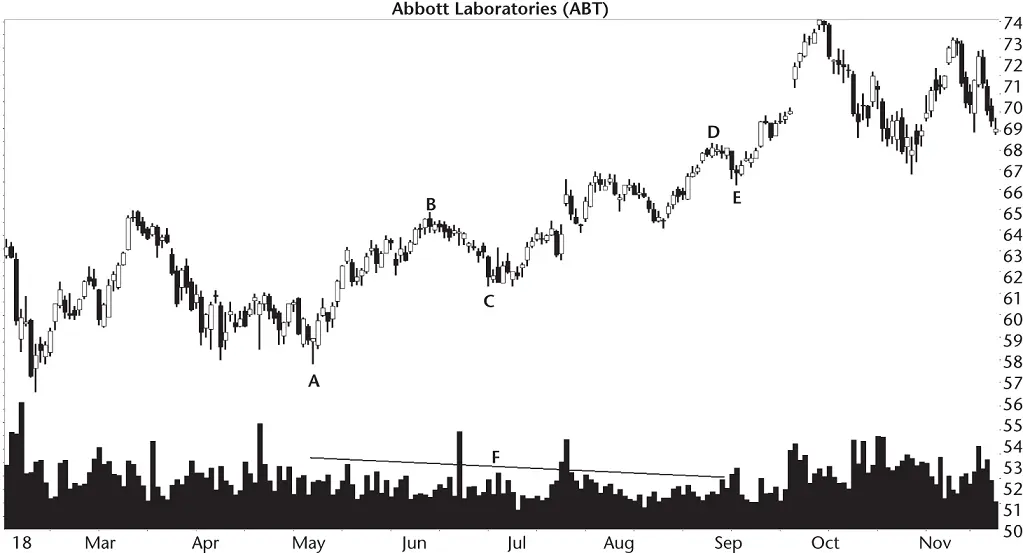
Figure 2.2 This bearish AB=CD pattern breaks out upward.
Let's talk about the Fibonacci ratios.
BC/AB retrace.Retrace BC compared to the height of BA is governed by the Fibonacci numbers listed in the table. Let's give your slide rule a workout and go through the math. The low at point A is 56.81, and the high at B is 63.85 for a height of 7.04. The low at C is 60.32. I tuned my software to find a turn within .01 (1%) of one of the numbers listed in the table, so we get (63.85 – 60.32)/(63.85 – 56.81) or 50.1%. That value is almost exactly the 50% retrace (.5). So the ABC turn meets the guidelines.
DC/BC extension.If you invert the ratio found in the last step, you use it to find the price of D. In this example, we found the closest Fibonacci number to be .5, so we'd expect point D to be twice as far away. To put it another way, let's pick a point D where the ratio of DC to BC is 2. The high at point D is 67.36, so the equation is (67.36 – 60.32)/(63.85 – 60.32) or 1.99 (or about 2).
We found turn ABC to obey one of the numbers listed in the table, and we also found point D using a Fibonacci extension (one of them listed in the table), so we found a valid AB=CD pattern.
In this example, price turns down at D, just like it's supposed to. However, the drop is brief (to E).
Hills and valleys.I excluded any pattern that had a peak or valley outside of the turns as described in the table.
Volume.Although it may not look like a downward volume trend in this example (F), linear regression says it recedes. In fact, you'll see volume trending downward in most AB=CD patterns and other chart pattern types, too. If volume trends upward, that's fine. Don't throw away a pattern because of an unusual volume trend.
Duration.I imposed a 6‐month limit to the length of most chart patterns, including the AB=CD. It's an arbitrary limit.
Focus on Failures
Figure 2.3shows an example of a failed bearish AB=CD pattern (labeled as turns ABCD). The pattern fails in multiple ways. The first is that price doesn't make it up to the predicted point D.
Turn A has a low price of 134.82, B has a high of 148.28, and C has a low of 139.95. That gives a BC/BA retrace of .618, so the turn qualifies as a valid AB=CD. It predicts that point D should be at 153.41 using the formula: D = (B – C)/Ratio + C.
As the figure shows, point D falls well short of the target, which I show as F. Instead, price rises only to D before dropping to E. Imagine that you wanted to trade the anticipated rise to point D by buying the stock soon after turn C. You placed a stop a few pennies below C, and you would have been stopped out at E, which reached a low of 139.79, slightly below the low at C.
As I mentioned in the Identification Guidelines, there can't be a low below C on the way to the calculated point D. Point E stops the search for D because it's below the low at C. If you ignore that rule, then you have discovered the second failure type.
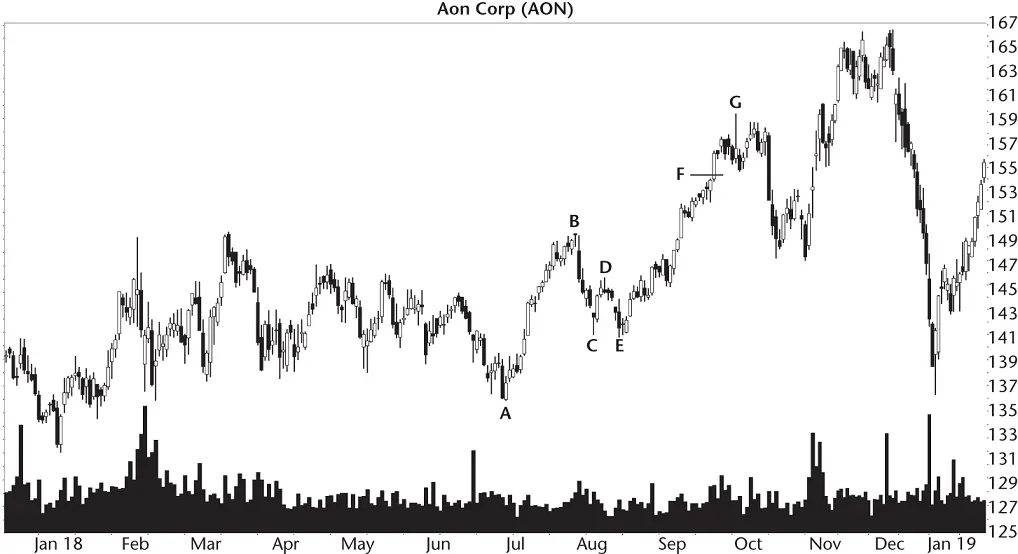
Figure 2.3 Price is supposed to turn down at F, but the search for point D ends when point E is below C.
The second way this AB=CD fails is when price continues rising instead of turning at D. If we ignore the lower low violation at E and assume price climbs to F, where turn D should be (153.41), then look what price does. It continues rising, doesn't it? So price fails to turn at the new target D and moves to G, peaking at 158.77, well above the 153.41 target. Shorting the stock at F would have tested a trader's courage against a rising price trend when the stock climbed to G.
Look back at Figure 2.2where it shows another example of how the pattern fails to see price decline much after D. Price drops from 67.36 (point D) to 65.22 (point E), a drop of 2.14 points or 3%. Could you make money shorting the stock at D, knowing that if you traded it perfectly, you'd make 3%?
Читать дальшеИнтервал:
Закладка:
Похожие книги на «Encyclopedia of Chart Patterns»
Представляем Вашему вниманию похожие книги на «Encyclopedia of Chart Patterns» списком для выбора. Мы отобрали схожую по названию и смыслу литературу в надежде предоставить читателям больше вариантов отыскать новые, интересные, ещё непрочитанные произведения.


Обсуждение, отзывы о книге «Encyclopedia of Chart Patterns» и просто собственные мнения читателей. Оставьте ваши комментарии, напишите, что Вы думаете о произведении, его смысле или главных героях. Укажите что конкретно понравилось, а что нет, и почему Вы так считаете.