Naoki Sugimoto - Chemistry and Biology of Non-canonical Nucleic Acids
Здесь есть возможность читать онлайн «Naoki Sugimoto - Chemistry and Biology of Non-canonical Nucleic Acids» — ознакомительный отрывок электронной книги совершенно бесплатно, а после прочтения отрывка купить полную версию. В некоторых случаях можно слушать аудио, скачать через торрент в формате fb2 и присутствует краткое содержание. Жанр: unrecognised, на английском языке. Описание произведения, (предисловие) а так же отзывы посетителей доступны на портале библиотеки ЛибКат.
- Название:Chemistry and Biology of Non-canonical Nucleic Acids
- Автор:
- Жанр:
- Год:неизвестен
- ISBN:нет данных
- Рейтинг книги:3 / 5. Голосов: 1
-
Избранное:Добавить в избранное
- Отзывы:
-
Ваша оценка:
Chemistry and Biology of Non-canonical Nucleic Acids: краткое содержание, описание и аннотация
Предлагаем к чтению аннотацию, описание, краткое содержание или предисловие (зависит от того, что написал сам автор книги «Chemistry and Biology of Non-canonical Nucleic Acids»). Если вы не нашли необходимую информацию о книге — напишите в комментариях, мы постараемся отыскать её.
Chemistry and Biology of Non-canonical Nucleic Acids — читать онлайн ознакомительный отрывок
Ниже представлен текст книги, разбитый по страницам. Система сохранения места последней прочитанной страницы, позволяет с удобством читать онлайн бесплатно книгу «Chemistry and Biology of Non-canonical Nucleic Acids», без необходимости каждый раз заново искать на чём Вы остановились. Поставьте закладку, и сможете в любой момент перейти на страницу, на которой закончили чтение.
Интервал:
Закладка:
(3.9) 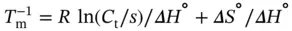
where R is the ideal gas constant, 1.987 cal K −1mol −1or 8.314 J K −1mol −1. The slope of the van't Hoff plot gives the Δ H °, and the y -intercept gives the ratio of Δ H °to Δ S °. The free energy and equilibrium constant at any temperature can then be calculated using Gibb's relation:
(3.10) 
To increase the accuracy of these parameters, data analysis can be performed by curve fitting as shown below. When the ratio of the double-stranded DNA is represented by α , absorbance ( A ) at a temperature ( T ) is calculated as
(3.11) 
where ε dsand ε ssindicate the absorbance for the single-stranded and double-stranded DNA, respectively, and l and C trepresent the length of the light pass (or the path length of the cuvette used) and the total concentration of DNA strands, respectively. The ε ds, ε ss, and observed equilibrium constant ( K obs) for the duplex formation can be represented as follows with the assumption that absorbance is directly proportional to temperature:
(3.12) 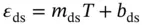
(3.13) 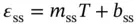
(3.14) 
where R is the gas constant and m dsand b dsor m ssand b ssrepresent the slope and intercept of the upper baseline or lower baseline for the melting curve of a duplex dissociation ( Figure 3.4b), respectively. The six variables ( ε ds, ε ss, b ds, b ss, Δ H °, and Δ S °) can be calculated by the curve fitting using Eqs. ( 3.11, 3.12, 3.13, 3.14). These calculations, which are performed using a PC equipped with the curve fitting software such as IGOR Pro, KaleidaGraph, or ORIGIN, derive the thermodynamic parameters from the shape of the melting curve.
Estimated errors in the thermodynamic values ( σ ΔH°, σ ΔS°, and  ) derived from the curve fitting procedure are calculated from the standard deviations among data points of each melting curve at different C tvalues. Estimated errors in Δ H °(σ ΔH°) and Δ S °(σ ΔS°) obtained from the
  versus ln( C t/ s ) plots are calculated from the linearity of the plots, and those for Δ
  (
(  ) are calculated using Eq. (3.15):
(3.15) 
where R ΔH°,ΔS°is the correlation coefficient between Δ H °and Δ S °. The final thermodynamic parameters are the average values obtained from curve fitting and the  versus ln( C t/ s ) plots. The errors of σ ΔH°, σ ΔS°, and
  are usually within several percent of each thermodynamic value.
3.4 Factors Influencing Stabilities of the Non-canonical Nucleic Acids
3.4.1 Factors Influencing Stability of Triplexes
It was shown that triplexes consist of two pyrimidine (Y) and one purine (R) strand (Y-R*Y, where dash and star indicate Watson–Crick and Hoogsteen base pairs, respectively) or of two purine and one pyrimidine strand (Y-R*R) (see Chapter 2) [6]. Figure 3.5shows a typical triplex structure. The building blocks of Y-R*Y triplexes are the canonical C-G*C and T-A*T triads shown in Figure 3.5a. To form such triads, the third strand must be located in the major groove of the duplex that is forming Hoogsteen hydrogen bonds with the purine strand of the duplex ( Figure 3.5a). The third strand also forms the stacking interaction with neighboring bases ( Figure 3.5b), although the stacking interactions are weak relative to that in the duplex. An important feature of the Y-R*Y triplexes is that formation of the C-G*C triad requires the protonation of the N3 of cytosine in the third strand. Thus, such triplexes are favorable under acidic conditions (see next paragraph). By contrast, the Y-R*R triplexes such as T-A*A and C-G*G usually do not require protonation. The mutual orientation of the chemically homologous strands in a triplex (i.e. two pyrimidine strands in the Y-R*Y triplex or the two purine strands in the Y-R*R triplex), which a priori can be either parallel or antiparallel, is of paramount importance. In general, the stability of triplexes consisting of alternating C-G*C and T-A*T triads is higher than that of triplexes built of C-G*G and T-A*A triads under the appropriate pH due to width of major groove of the duplex. The requirement for protonation of third-strand cytosines for triplex formation makes the thermal stabilities of triple helices that include C-G*C triples sensitive to pH. For isolated C residues, this pH sensitivity is linearly dependent on the fraction of cytosines in the third strand. From the pH dependence of T mand knowledge of the enthalpy of the transition, the number of protons released upon triplex disruption can be estimated. Generally, it was found that the number of released protons is smaller than the number of cytosines in putative C-G*C base triads. This observation could indicate partial protonation of the cytosines in the resultant single strands at low pH. Substitution of 5-methylcytosine for cytosine that is the most widely used base modification increases the stabilities of polymeric and oligomeric triplexes over a range of pH, thereby increasing the pH range in which stable triplexes are observed. As an example, an intramolecular triplex (iT)) in Figure 3.6ashows a typical melting behavior. The triplex structure exhibits typically two-melting transition at neutral or higher pH. The first and second melting transitions depend on dissociation of Hoogsteen base pairs in the third strand and Watson–Crick base pairs in the second strand, respectively. The stability of the Hoogsteen base pairs depends on the solution pH. Thus, the unfolding processes for the triplexes are different depending on the solution pH ( Figure 3.6b): the T mvalues for Hoogsteen base pairs are increased with decreasing solution pH, although T mvalues for Watson–Crick base pairs are not significantly affected by the pH of the solution.
Читать дальшеИнтервал:
Закладка:
Похожие книги на «Chemistry and Biology of Non-canonical Nucleic Acids»
Представляем Вашему вниманию похожие книги на «Chemistry and Biology of Non-canonical Nucleic Acids» списком для выбора. Мы отобрали схожую по названию и смыслу литературу в надежде предоставить читателям больше вариантов отыскать новые, интересные, ещё непрочитанные произведения.


Обсуждение, отзывы о книге «Chemistry and Biology of Non-canonical Nucleic Acids» и просто собственные мнения читателей. Оставьте ваши комментарии, напишите, что Вы думаете о произведении, его смысле или главных героях. Укажите что конкретно понравилось, а что нет, и почему Вы так считаете.