Eleftheria Papadimitriou - Statistical Methods and Modeling of Seismogenesis
Здесь есть возможность читать онлайн «Eleftheria Papadimitriou - Statistical Methods and Modeling of Seismogenesis» — ознакомительный отрывок электронной книги совершенно бесплатно, а после прочтения отрывка купить полную версию. В некоторых случаях можно слушать аудио, скачать через торрент в формате fb2 и присутствует краткое содержание. Жанр: unrecognised, на английском языке. Описание произведения, (предисловие) а так же отзывы посетителей доступны на портале библиотеки ЛибКат.

- Название:Statistical Methods and Modeling of Seismogenesis
- Автор:
- Жанр:
- Год:неизвестен
- ISBN:нет данных
- Рейтинг книги:5 / 5. Голосов: 1
-
Избранное:Добавить в избранное
- Отзывы:
-
Ваша оценка:
Statistical Methods and Modeling of Seismogenesis: краткое содержание, описание и аннотация
Предлагаем к чтению аннотацию, описание, краткое содержание или предисловие (зависит от того, что написал сам автор книги «Statistical Methods and Modeling of Seismogenesis»). Если вы не нашли необходимую информацию о книге — напишите в комментариях, мы постараемся отыскать её.
Statistical Methods and Modeling of Seismogenesis — читать онлайн ознакомительный отрывок
Ниже представлен текст книги, разбитый по страницам. Система сохранения места последней прочитанной страницы, позволяет с удобством читать онлайн бесплатно книгу «Statistical Methods and Modeling of Seismogenesis», без необходимости каждый раз заново искать на чём Вы остановились. Поставьте закладку, и сможете в любой момент перейти на страницу, на которой закончили чтение.
Интервал:
Закладка:
– Step 5. Estimating The estimator [1.3]is differentiable:
[1.23] 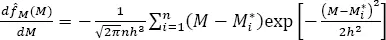
[1.24] 
For 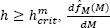 only has one zero. For
 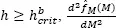 only has one zero. The search for
  begins from small values of h , for which the derivatives [1.23]and [1.24]have more than one zero, respectively. One increases h gradually until the number of zeros of the respective derivatives becomes one. Acceptable critical bandwidth estimates are obtained when the step change of h is equal to 0.001. The estimates are, in this case, attained with precision 10 -3. However, to search the critical bandwidths, more complex numerical methods may also be applied.
– Step 6. Drawing R n-element samples from ( equation [1.3]) when testing H01 (modes), and from when testing H02 (bumps). The sampling is done through the smoothed bootstrap technique. For testing H01, the drawn samples are:
[1.25] 
where  comes from n -times uniform selection with replacement from the original data
  (standard bootstrap), and εi are the standard normal random numbers.
Silverman (1986) and Efron and Tibshirani (1993) indicated that the samples  have greater variance than the original data,
  and that this leads to an artificial increase of the significance of the null hypothesis. To remedy this problem, Efron and Tibshirani (1993) recommended using:
[1.26] 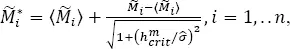
where  are the mean and the sample variance of
  rather than
  because
  has approximately the same variance as
  However, when testing magnitudes with the use of samples [1.26], we were occasionally receiving distinctly erroneous results; therefore, we suggest carrying out the tests independently twice, using samples [1.25]and [1.26], respectively. The tests results should be comparable.
When testing H02 we use  in [1.25]and [1.26].
– Step 7. Calculating the test p-value. To do this we count how many samples of R, drawn in step 6, result in the kernel estimates of PDF [1.3], which only have one mode (or only one bump when testing H02). This can be achieved by studying the first derivative of the estimate obtained from [1.23](the second derivative obtained from [1.24]when testing H02) in which [1.25]or [1.26]replaces The tests p-values are:
[1.27] 
and
[1.28] 
for testing H01 and H02, respectively.
– Step 8. Calibrating p-values. Lasocki and Papadimitriou (2006) checked the agreement between the p-values obtained from [1.27]and [1.28], and the expected p-values from the p-value definition. To do this they applied the testing procedure to a large number of Monte Carlo samples drawn from the exponential distribution [1.19]. Their tests showed that the p-values estimates, [1.27]and [1.28], could significantly deviate from their actual values, probably because of the skewness of the exponential distribution. Because this can impact the final test result, the cited authors suggested calibrating the p-values estimates, [1.27]and [1.28]. For this purpose, we draw a large number of samples from the exponential distribution [1.19]with the parameter β obtained in step 3. The calibrated p-value estimate, pm_cat, is the proportion of these samples, whose p-values obtained after performing steps 5–7 are less than or equal to pm. The calibration of pm is done in the same way.
The comparison of the calibrated p -value with the assumed test significance level α finalizes the test(s).
In a considerable proportion of studied cases, the above-presented tests questioned the exponential model for magnitude distribution. Such results were obtained for both worldwide and regional catalogs of natural earthquakes (Lasocki and Papadimitriou 2006; Lasocki 2007), as well as for anthropogenic seismicity data (e.g. Lasocki 2001; Lasocki and Orlecka-Sikora 2008, Urban et al . 2016; Leptokaropoulos 2020). Furthermore, the additional modes or bumps located in the ranges of larger magnitudes, as shown above, can yield significant errors of seismic hazard estimates. In this connection, new approaches for estimating the magnitude distributions are needed.
The smooth bootstrap test for multimodality of magnitude distribution has been implemented on the IS-EPOS Platform (tcs.ah-epos.eu). The platform integrates and provides free access to the research infrastructure of anthropogenic seismicity and the related hazards (Orlecka-Sikora et al . 2020).
1.3. Kernel estimation of magnitude distribution
Интервал:
Закладка:
Похожие книги на «Statistical Methods and Modeling of Seismogenesis»
Представляем Вашему вниманию похожие книги на «Statistical Methods and Modeling of Seismogenesis» списком для выбора. Мы отобрали схожую по названию и смыслу литературу в надежде предоставить читателям больше вариантов отыскать новые, интересные, ещё непрочитанные произведения.


Обсуждение, отзывы о книге «Statistical Methods and Modeling of Seismogenesis» и просто собственные мнения читателей. Оставьте ваши комментарии, напишите, что Вы думаете о произведении, его смысле или главных героях. Укажите что конкретно понравилось, а что нет, и почему Вы так считаете.