1 ...6 7 8 10 11 12 ...21 The kernel estimation of magnitude distribution follows the general kernel estimation methods presented in Silverman (1986), with some adaptations to the specific features of magnitude (Kijko et al . 2001; Orlecka-Sikora and Lasocki 2005; Lasocki and Orlecka-Sikora 2008).
As already mentioned, magnitude datasets contain many repetitions. The kernel estimation of distribution functions is applicable for continuous random variables; hence, firstly, we should randomize magnitudes according to [1.21].
The estimation is based on the sample being representative of a population. The definition of the catalog completeness level, Mc , implicates the use of the magnitudes M ≥ Mc only.
The magnitude PDF is a steeply, exponentially like, the decreasing function. The larger the magnitudes are, the more sparse they are in data samples. In the seismic hazard studies, we are mainly interested in larger magnitudes. To ensure a better estimation of the distribution functions in the sparse data range, we use the estimators with the adaptive kernel [1.5]and [1.6]. For the left-hand side limited distribution of magnitude they take the form of:
[1.29] 
[1.30] 
The magnitude PDF has the global maximum at the catalog completeness level, Mc , and is zero for M < Mc . For this reason the data sample is mirrored symmetrically around Mc , and the estimation is carried out using the estimator [1.12]in the way described in section 1.1.
When the existence of a strict, single value upper bound to the magnitude range, Mmax , is assumed, the estimators of magnitude distribution functions are:
[1.31] 
[1.32] 
Kijko et al . (2001) compared the performances of the kernel estimation of magnitude distribution functions and the estimation based on the exponential distribution model [1.20]. For this purpose, they estimated the distribution functions, using Monte Carlo samples drawn from two distributions, mimicking real instances of magnitude distribution. The considered starting distributions were the exponential distribution [1.20]and the bi-component distribution, comprised of a dominant exponential component and a secondary normal component. For the samples drawn from the exponential distribution, the kernel estimates were only insignificantly worse than the estimates obtained with the use of the model [1.20]. For the samples drawn from the bi-component distribution, the kernel estimates fitted the starting distribution well, whereas the estimates based on the exponential model [1.20]deviated strongly from the starting distribution. Kijko et al . (2001) used these results as an argument advocating for more frequent use of the kernel estimation of magnitude distribution, particularly in seismic hazard studies.
1.4. Implications for hazard assessments
The kernel estimate of magnitude CDF and such an estimate based on the exponential model [1.20], both obtained for the actual seismicity case from the Northern Aegean Sea (Greece), are represented in Figure 1.4, taken from Lasocki and Papadimitriou (2006). We can see that the kernel estimate better fits the observed data, though the difference between these two estimates in the larger magnitude range is pretty tiny. However, due to the significant impact of the magnitude CDF on the parameters of hazard [1.17]and [1.18], the difference between the mean return period estimates is dramatic. For instance, for magnitude 6.5, the return period obtained from the exponential distribution model is close to 100 years. The kernel estimate of this return period is less than 10 years. Lasocki and Papadimitriou (2006) compared the “exponential” and “kernel” estimates of the mean return period for different magnitudes, with the estimates drawn from the actual observations done in the preceding 94 years ( Figure 1.5). The differences between the “kernel” estimates and the assessments from actual observations were insignificant compared to the huge deviation of the “exponential” estimate. This led to the conclusion that the “kernel” estimate was much better than the “exponential” one.
Also, many other studies indicated big differences between the “exponential” and “kernel” estimates of hazard parameters. The mentioned Monte Carlo analyses by Kijko et al . (2001), and the actual data studies by Lasocki and Papadimitriou (2006), suggest that in the case when these estimates differ, the “kernel” estimate is more accurate. All of this favors the kernel estimation of magnitude distribution functions for the seismic hazard assessment.
The PSHA, which uses the kernel estimation of magnitude distribution as an alternative to the parametric model [1.19]and [1.20], has been implemented on the IS-EPOS Platform (tcs.ah-epos.eu, Orlecka-Sikora et al . 2020). The kernel estimation of magnitude distribution is also applied in the SHAPE software package for time-dependent seismic hazard analysis (Leptokaropoulos and Lasocki 2020). SHAPE is open-source, downloadable from https://git.plgrid.pl/projects/EA/repos/seraapplications/browse/SHAPE_Package.
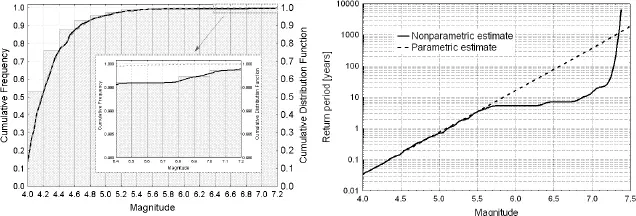
Figure 1.4. Comparison of the estimates obtained from the kernel estimation method (solid lines) and from the exponential model of magnitude distribution (dashed lines) for the data from the Northern Aegean Sea. Left – the CDF estimates juxtaposed with the cumulative histogram of magnitude data. Right – the mean return period estimates. Reprinted from Lasocki and Papadimitriou (2006, Figures 5b and 6b)

Figure 1.5. “Kernel” (circles) and “exponential” (squares) estimates of the mean return periods juxtaposed with the mean return period estimates drawn from the actual 94 year-long observations of seismicity in the Northern Aegean Sea (diamonds). Reprinted from Lasocki and Papadimitriou (2006, Figure 7b)
1.5. Interval estimation of magnitude CDF and related hazard parameters
Orlecka-Sikora (2004, 2008) presented a method for assessing the confidence intervals of the CDF, which had been estimated by the kernel estimation. The method is based on the bias-corrected and accelerating method by Efron (1987), the smoothed bootstrap and the second-order bootstrap samples, and is called the iterative bias-corrected and accelerating method (IBCa).
To simplify the notation let: { M i}, i = 1,.., n be an n -element sample of already randomized magnitudes [1.21],  be the kernel estimate of CDF of magnitude [1.30]or [1.32], h be the optimal bandwidth obtained from [1.10], { ω i}, i = 1,.. n be the weights [1.7]and α define the confidence interval of length 1 − 2 α . The IBCa method begins by generating the jackknife and the smoothed bootstrap samples of the first and second orders.
Читать дальше



 be the kernel estimate of CDF of magnitude [1.30]or [1.32], h be the optimal bandwidth obtained from [1.10], { ω i}, i = 1,.. n be the weights [1.7]and α define the confidence interval of length 1 − 2 α . The IBCa method begins by generating the jackknife and the smoothed bootstrap samples of the first and second orders.

