Spectroscopy for Materials Characterization
Здесь есть возможность читать онлайн «Spectroscopy for Materials Characterization» — ознакомительный отрывок электронной книги совершенно бесплатно, а после прочтения отрывка купить полную версию. В некоторых случаях можно слушать аудио, скачать через торрент в формате fb2 и присутствует краткое содержание. Жанр: unrecognised, на английском языке. Описание произведения, (предисловие) а так же отзывы посетителей доступны на портале библиотеки ЛибКат.

- Название:Spectroscopy for Materials Characterization
- Автор:
- Жанр:
- Год:неизвестен
- ISBN:нет данных
- Рейтинг книги:5 / 5. Голосов: 1
-
Избранное:Добавить в избранное
- Отзывы:
-
Ваша оценка:
Spectroscopy for Materials Characterization: краткое содержание, описание и аннотация
Предлагаем к чтению аннотацию, описание, краткое содержание или предисловие (зависит от того, что написал сам автор книги «Spectroscopy for Materials Characterization»). Если вы не нашли необходимую информацию о книге — напишите в комментариях, мы постараемся отыскать её.
Learn foundational and advanced spectroscopy techniques from leading researchers in physics, chemistry, surface science, and nanoscience Spectroscopy for Materials Characterization,
Simonpietro Agnello
Spectroscopy for Materials Characterization
Spectroscopy for Materials Characterization — читать онлайн ознакомительный отрывок
Ниже представлен текст книги, разбитый по страницам. Система сохранения места последней прочитанной страницы, позволяет с удобством читать онлайн бесплатно книгу «Spectroscopy for Materials Characterization», без необходимости каждый раз заново искать на чём Вы остановились. Поставьте закладку, и сможете в любой момент перейти на страницу, на которой закончили чтение.
Интервал:
Закладка:
While femtosecond stimulated Raman can be used as a way to record a ground state Raman spectrum, the final goal of these experiments is usually following the evolution initiated by the actinic pump, with time resolution given by the cross‐correlation of the actinic and Raman probe pulses, which can reach a few tens of femtoseconds. To do so, the stimulated Raman spectrum for the unexcited sample is compared to that obtained at variable delays from photoexcitation, in order to follow the effect of relaxation. The result of the experiment can be plotted either in terms of an absolute, time‐dependent Raman spectrum (e.g. as in Figure 3.6c), which contains both the features of the unexcited ground molecules and those of the excited molecules, or as a difference Raman spectrum, calculated with respect to the unexcited sample.
Figure 3.7represents a typical experimental setup [60]. The actinic pump is obtained by a NOPA pumped by an amplified Ti:sapphire laser, allowing for tunable excitation as in a typical TA experiment. The remaining portion of the amplifier is used to generate both the Raman pump and probe pulses. In order to narrow down the bandwidth of the Raman pump pulse, the amplifier output traverses narrow band‐pass interference filters (BPF in Figure 3.7). Alternatively, one can use more complex prism‐ or grating‐based filters, which allow fine control of both the central wavelength and bandwidth. In this particular case, the picosecond Raman pump pulse is centered at 793 nm with bandwidth of 1.1 nm and a duration of several picoseconds. Its intensity is kept relatively high (∼1 μJ pulse −1) in order to optimize the amount of Raman scattering produced. The Raman probe pulse is obtained through supercontinuum generation (400–1000 nm) in a sapphire plate, followed by compression in a prism pair wherein only the near‐IR portion of the continuum is retained. In this way, a 80 fs pulse is obtained covering the 870–950 nm region, that corresponds to 1000–2000 cm −1Raman shifts from the Raman pump. The intensity of the Raman probe is much lower than that of the Raman pump, typically in the range of tens of nJ pulse −1. Finally, the three pulses are made collinear and focused in the same spot (sized a few tens of μm) of the flow cell containing the sample. After traversing the sample, the Raman probe beam is spatially selected, goes through a spectrograph, and analyzed in an array detector.
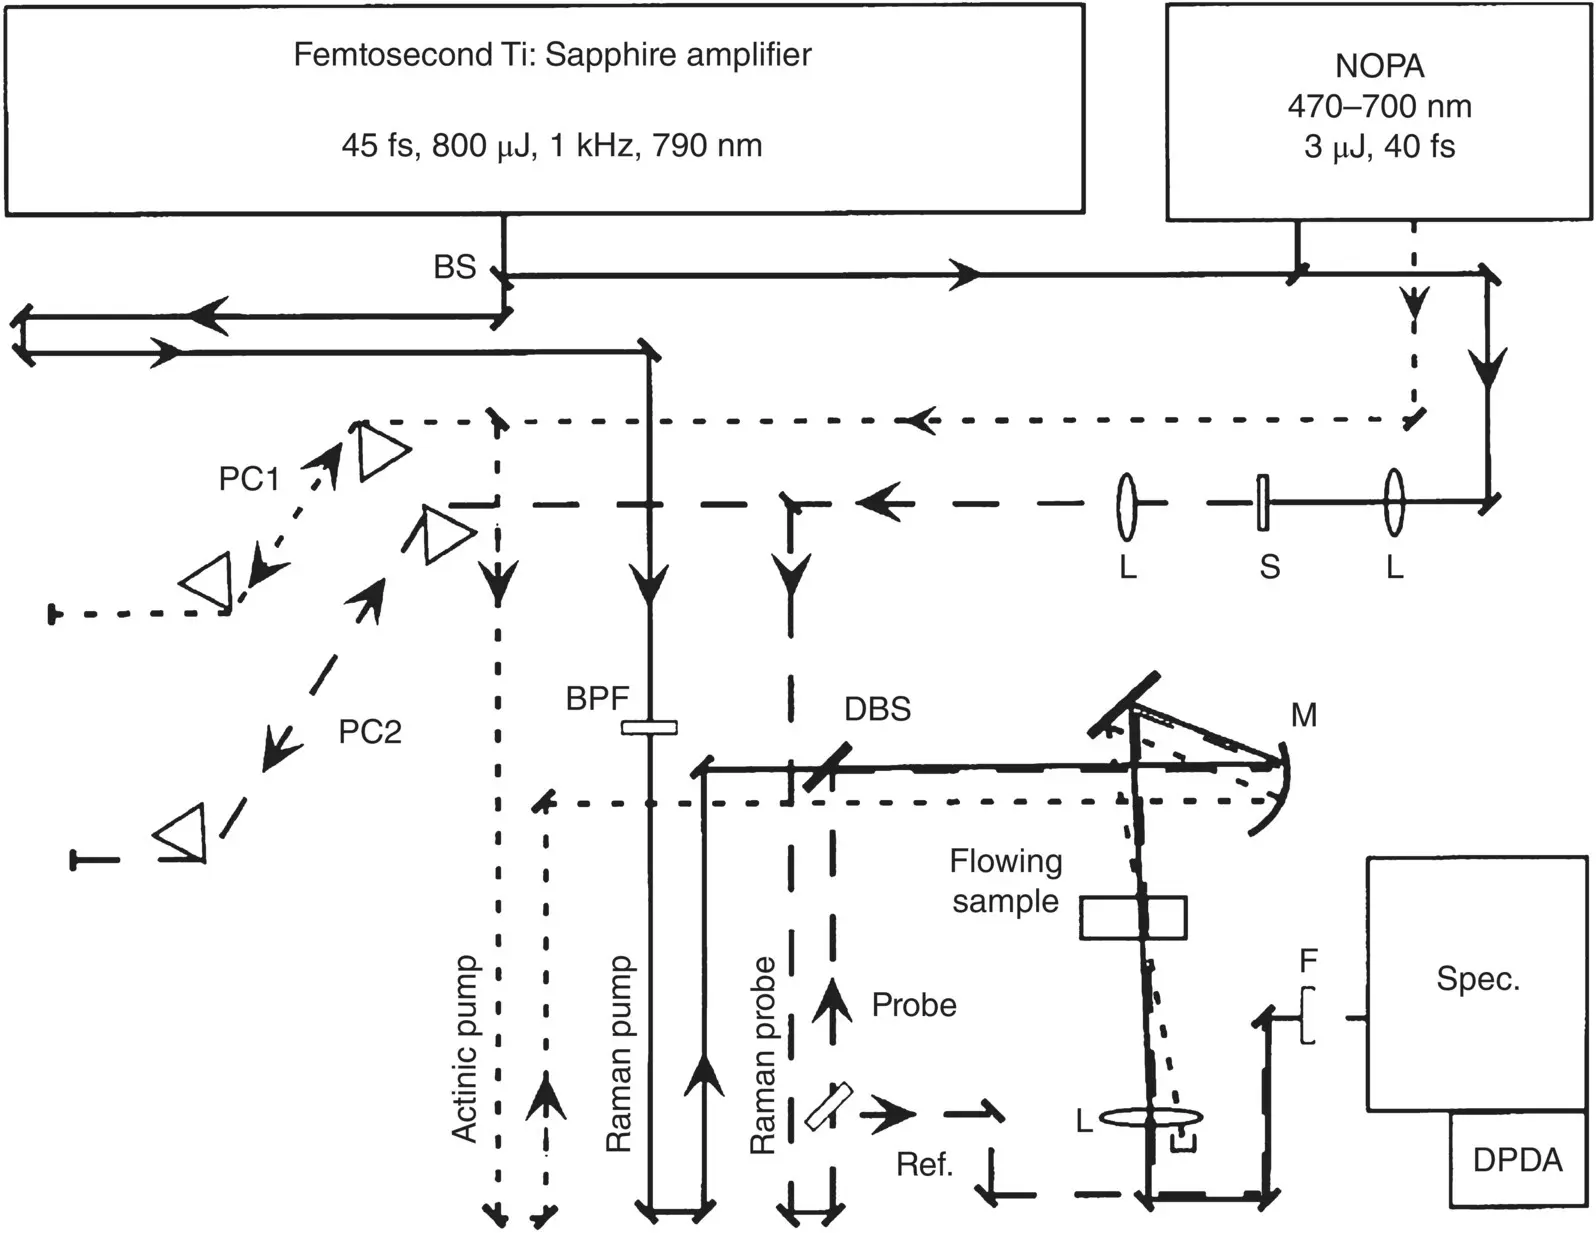
Figure 3.7A possible configuration for a time‐resolved stimulated Raman experiment.
Source: Adapted with permission from McCamant et al. [60]. Copyright (2003) American Chemical Society.
Several variants of this general scheme are possible. In some setups, for example, tunable Raman pump and probe pulses are both obtained by NOPAs [62]. In other cases, the fundamental beam from the amplifier was directly used as the Raman probe [63]. In regard to detection, some setups make use of a reference beam [60]: the probe is split in two in order to generate a reference beam, allowing for efficient shot‐to‐shot normalization of white light fluctuations. Experiments have been conducted over a wide range of Raman pump wavelengths, from the near IR to the UV [64]. This wide flexibility also allows to tune the Raman pump for pre‐resonant [63] and resonant [53] Raman process, which provides a convenient route to further enhance the Raman signal, and to single out the Raman contribution from the chromophore of interest.
In regard to data acquisition, several pulse chopping sequences can be used in this type of experiments [52]. By a simple chopper in the Raman pump path, one can acquire the stimulated Raman spectrum from the ratio between Raman‐pumped and Raman‐unpumped spectra cyclically recorded by the array detector. Then, the Raman spectra of the ground state and photoexcited sample can be obtained sequentially, and compared to each other, by shuttering the actinic pump. If the chopper is positioned in the path of the actinic pump, the ratio between chopped and unchopped signals directly records the difference Raman spectrum induced by photoexcitation. More complex schemes where both the actinic and Raman pump are chopped are sometimes used as well [64].
3.5.3 Data Analysis and Interpretation
Data analysis of TRR data involves a series of additional steps which do not have a counterpart in TA, and the details of which depend on the specific pulse sequence used in the acquisition. A typical analysis workflow is illustrated in [65]. If chopping the actinic pump only, one can directly acquire the difference Raman spectrum induced by photoexcitation. The latter will always “sit” over a broad background due to transient absorption changes of the Raman probe beam. Therefore, one always needs to separately measure the TA and subtract it from the recorded signal. The signal after TA subtraction contains the excited state Raman spectrum, ground state Raman bleach contributions, but also some residual contributions of the solvent, due to attenuation of the Raman pump by photoexcited molecules. Therefore, one needs to separately measure and subtract the pure solvent Raman signal, which is rescaled and subtracted in order to get the final difference spectrum. Some specific additional problems which are not encountered in TA may arise both at the time of setup alignment or data processing. For example, the data may contain spurious contributions due to the cross‐phase modulation between Raman pump and probe beams. Several strategies have been proposed to minimize these effects, such as vibrating the Raman pump retroreflector to average out CPM effect [61].
TRR experiments exploiting stimulated Raman scattering are now very well‐established in the toolbox of ultrafast spectroscopies. They are powerful tools capable of following the ultrafast dynamics of photoexcited systems by revealing structurally precise details of the undergoing events through the changes of their vibrational mode pattern. The interpretation of time‐resolved vibrational data follows basically the same principles as ordinary steady state vibrational spectroscopy, where characteristic fingerprint vibrations are highly structure‐specific and, in some frequency regions, can be traced back to specific chemical moieties. The main difference with a steady state Raman experiment is that the vibrational properties change as a result of the electronic redistribution induced by photoexcitation, and of subsequent system dynamics. For example, molecular internal conversion can be pinpointed unambiguously through the appearance and disappearance of the unique fingerprint vibration patterns associated to each of the involved states [66]. On these grounds, TRR methods have been extensively used to interrogate ultrafast photochemical processes such as charge transfer, proton transfer, isomerization, or internal conversion, as demonstrated by many examples in the literature of the last two decades [50, 53, 66, 67].
3.6 Case Studies
3.6.1 Ultrafast Relaxation Dynamics of Molecules in Solution Phase
Transition metal complexes, such as metal–polypyridine complexes, are very interesting for several photochemical and solar energy harvesting applications, such as dye‐sensitized solar cells (DSSCs). The excited state dynamics of these molecules display several phenomena which make them a particularly interesting topic in the “ultrafast” community. One of the typical electronic absorption bands of many metal complexes, named metal‐to‐ligand charge transfer (MLCT), involves an optical charge transfer from the metal to the ligands around it. Excitation within MLCT electronic transitions is the first step toward electron injection in DSSCs, and gives rise to peculiar dynamical behavior which can only be addressed by ultrafast spectroscopic techniques.
Читать дальшеИнтервал:
Закладка:
Похожие книги на «Spectroscopy for Materials Characterization»
Представляем Вашему вниманию похожие книги на «Spectroscopy for Materials Characterization» списком для выбора. Мы отобрали схожую по названию и смыслу литературу в надежде предоставить читателям больше вариантов отыскать новые, интересные, ещё непрочитанные произведения.


Обсуждение, отзывы о книге «Spectroscopy for Materials Characterization» и просто собственные мнения читателей. Оставьте ваши комментарии, напишите, что Вы думаете о произведении, его смысле или главных героях. Укажите что конкретно понравилось, а что нет, и почему Вы так считаете.