Spectroscopy for Materials Characterization
Здесь есть возможность читать онлайн «Spectroscopy for Materials Characterization» — ознакомительный отрывок электронной книги совершенно бесплатно, а после прочтения отрывка купить полную версию. В некоторых случаях можно слушать аудио, скачать через торрент в формате fb2 и присутствует краткое содержание. Жанр: unrecognised, на английском языке. Описание произведения, (предисловие) а так же отзывы посетителей доступны на портале библиотеки ЛибКат.

- Название:Spectroscopy for Materials Characterization
- Автор:
- Жанр:
- Год:неизвестен
- ISBN:нет данных
- Рейтинг книги:5 / 5. Голосов: 1
-
Избранное:Добавить в избранное
- Отзывы:
-
Ваша оценка:
Spectroscopy for Materials Characterization: краткое содержание, описание и аннотация
Предлагаем к чтению аннотацию, описание, краткое содержание или предисловие (зависит от того, что написал сам автор книги «Spectroscopy for Materials Characterization»). Если вы не нашли необходимую информацию о книге — напишите в комментариях, мы постараемся отыскать её.
Learn foundational and advanced spectroscopy techniques from leading researchers in physics, chemistry, surface science, and nanoscience Spectroscopy for Materials Characterization,
Simonpietro Agnello
Spectroscopy for Materials Characterization
Spectroscopy for Materials Characterization — читать онлайн ознакомительный отрывок
Ниже представлен текст книги, разбитый по страницам. Система сохранения места последней прочитанной страницы, позволяет с удобством читать онлайн бесплатно книгу «Spectroscopy for Materials Characterization», без необходимости каждый раз заново искать на чём Вы остановились. Поставьте закладку, и сможете в любой момент перейти на страницу, на которой закончили чтение.
Интервал:
Закладка:
Interestingly, because of the phase matching condition, the SFG process is automatically polarization sensitive, meaning that only the fluorescence component that has the same polarization of the gate (type I phase matching) is upconverted in the BBO and detected by the setup. Therefore, by adding a waveplate in the pump arm, as in a TA experiment, the polarization of the latter can be controlled, and polarization‐sensitive measurements can be easily achieved by a setup such as in Figure 3.5. To achieve this aim, one repeats each measurement in the two pump polarizations, parallel ( para ) or perpendicular ( ortho ) to the gate, respectively, and calculates the fluorescence anisotropy r ( t ):
(3.18) 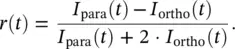
Femtosecond fluorescence anisotropy measurements often provide important information regarding the occurrence of random rotational diffusion within the system, or any other phenomena (e.g. energy transfer and site‐to‐site excitation migration) capable of randomizing the orientation of the electric dipoles [46].
The actual design of a FLUC setup involves a relatively complex optimization problem involving multiple geometrical parameters to find the best compromise between signal intensity, noise rejection, and time resolution. While this topic cannot be fully covered here, a significant example is given by the geometry of the telescope directing the fluorescence into the nonlinear crystal. In fact, the focal lengths of the two parabolic mirrors used in Figure 3.5must be chosen in such a way that the fluorescence enters the BBO within the acceptance angle for the SFG process. If n ois the ordinary refractive index, and θ mis the phase matching angle, the SFG acceptance angle is given by [47]:
(3.19) 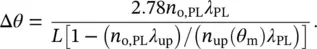
The need to fulfill this condition imposes relatively tight limitations on the possible geometrical parameters of a setup such as in Figure 3.5. Similar considerations can be done for many other relevant geometrical parameters, the optimization of which constitutes an important aspect in the design of any FLUC setup [47].
3.4.3 FLUC: Data Analysis and Interpretation
Data collected in a FLUC experiments are usually single‐wavelength traces. The treatment and correction of the data involve, as for the TA, the definition of a common zero time for all the kinetics, the GVD correction, and an assessment of the temporal resolution. A useful technique to measure the temporal resolution is the measurement of the temporal evolution of a Raman signal of a pure solvent. Because Raman scattering is essentially instantaneous, the temporal width of the Raman signal corresponds to the IRF of the experiment and it can be used to calibrate the experiment. After these preliminary procedures, the results can be treated by GA methods similar to what discussed above for TA, although FLUC data are generally much easier to interpret, inasmuch as they are much less affected by spectral congestion issues, and only contain one type of signal, that is spontaneous emission. In fact, many FLUC signals essentially consist in a single time‐dependent fluorescence band, or a few with no mutual overlap. In this case, FLUC data are often simpler to analyze by direct band integration methods (e.g. moment analysis), leading to very straightforward interpretations. For example, one popular application of FLUC is probing solvent relaxations around a chromophore through the observation of picosecond and femtosecond dynamical Stokes shift induced on its fluorescence band. This approach has proven very valuable to analyze solvation dynamics in water [3], and hydration dynamics around proteins, a problem of great biological importance [4, 44].
3.4.4 Kerr‐Based Femtosecond Fluorescence Spectroscopy
Kerr‐based femtosecond fluorescence spectroscopy exploits the optical Kerr effect, through which a material becomes birefringent under the action of the intense electric field provided by a light pulse [48, 49]. As for upconversion method, the sample is pumped by a laser beam and the consequent fluorescence is collected. Unlike FLUC, the emission is focused into an isotropic Kerr medium (glass plate or solvent) arranged between two crossed polarizers intercepting the fluorescence path. In standard conditions, the output after the second polarizer is zero (closed shutter condition). When the gate pulse passes through the Kerr media, it opens the shutter , by inducing a transient change in the refractive indexes of the medium that makes it birefringent. Thereby, the emission traversing the Kerr cell becomes elliptically polarized, a portion of it passes through the second polarizer, and reaches the detector. Changing the delay between the pump and the gate then allows to record fluorescence kinetics. In can be shown that the gate pulse should be polarized at 45 ∘with respect to the excitation in order to obtain maximum output [48]. Considering that a phase matching condition is not required in this scheme, a broadband detection is easy and limited only by the optical absorption of the used components and of the detection device.
The temporal resolution is determined by whatever is shorter between the cross‐correlation between excitation and gate and the cross‐correlation between the excitation and the intrinsic response function of the Kerr medium. In fact, if the Kerr medium reacts slowly to the gate modifications, then the temporal resolution is dominated by the latter. For example, with an excitation of ≈50 fs at 475 nm and a gate of 40 fs, the time resolution is ≈120 fs using a 1 mm‐thick fused silica plate as a Kerr medium [49].
3.5 Femtosecond Stimulated Raman Spectroscopy
Femtosecond time‐resolved methods are not limited to electronic spectroscopies, but can also be extended to meet the advantages of vibrationally sensitive techniques, such as infrared absorption and Raman. In this regard, this section addresses ultrafast stimulated Raman spectroscopy, which is one of the most powerful methods to combine the structural sensitivity and chemical selectivity of vibrational methods with the power of femtosecond time resolution [50–55].
3.5.1 The Experimental Method
Classic Raman spectroscopy exploits the Raman effect, discussed in detail in Chapter 5of this book, that is the inelastic scattering of light associated to the generation or annihilation of vibrational quanta of energy ω Vduring the interaction of the light beam with the system under study. A typical steady state Raman experiment interrogates the sample by a laser beam at ω , and analyzes the spectral distribution of photons scattered in all directions. In the most common case (Stokes Raman scattering), part of the scattered radiation is found to be red‐shifted to ω ′ = ω − ω V, because an energy ω Vhas been spent to excite phonons of this frequency within the sample. Thus, spectral analysis of the scattered radiation reveals a series of peaks at various ω Vreporting on the vibrational mode structure of the system. Vibrational frequencies being much smaller than visible ones, the exciting beam must be narrow enough in frequency to avoid spectral overlap between ω and ω ′. Therefore, the vibrational spectral resolution is of the order of the FWHM of the Raman pump beam. Raman spectroscopy is a powerful probe of the vibrational mode structure of any physical system and displays a sensitive dependence on both electronic and molecular structure. Thus, it can be used for accurate chemical recognition and to reveal, with high specificity, any structural changes of the system at study.
Читать дальшеИнтервал:
Закладка:
Похожие книги на «Spectroscopy for Materials Characterization»
Представляем Вашему вниманию похожие книги на «Spectroscopy for Materials Characterization» списком для выбора. Мы отобрали схожую по названию и смыслу литературу в надежде предоставить читателям больше вариантов отыскать новые, интересные, ещё непрочитанные произведения.


Обсуждение, отзывы о книге «Spectroscopy for Materials Characterization» и просто собственные мнения читателей. Оставьте ваши комментарии, напишите, что Вы думаете о произведении, его смысле или главных героях. Укажите что конкретно понравилось, а что нет, и почему Вы так считаете.