Handbook of Aggregation-Induced Emission, Volume 1
Здесь есть возможность читать онлайн «Handbook of Aggregation-Induced Emission, Volume 1» — ознакомительный отрывок электронной книги совершенно бесплатно, а после прочтения отрывка купить полную версию. В некоторых случаях можно слушать аудио, скачать через торрент в формате fb2 и присутствует краткое содержание. Жанр: unrecognised, на английском языке. Описание произведения, (предисловие) а так же отзывы посетителей доступны на портале библиотеки ЛибКат.
- Название:Handbook of Aggregation-Induced Emission, Volume 1
- Автор:
- Жанр:
- Год:неизвестен
- ISBN:нет данных
- Рейтинг книги:3 / 5. Голосов: 1
-
Избранное:Добавить в избранное
- Отзывы:
-
Ваша оценка:
Handbook of Aggregation-Induced Emission, Volume 1: краткое содержание, описание и аннотация
Предлагаем к чтению аннотацию, описание, краткое содержание или предисловие (зависит от того, что написал сам автор книги «Handbook of Aggregation-Induced Emission, Volume 1»). Если вы не нашли необходимую информацию о книге — напишите в комментариях, мы постараемся отыскать её.
A thorough introduction to the mechanistic understanding of the importance of molecular motion to aggregation-induced emission An exploration of the aggregation-induced emission mechanism at the molecular level Practical discussions of aggregation-induced emission from the restriction of double bond rotation at the excited state, and clusterization-triggered emission Perfect for academic researchers working on aggregation-induced emission, this set of volumes is also ideal for professionals and students in the fields of photophysics, photochemistry, materials science, optoelectronic materials, synthetic organic chemistry, macromolecular chemistry, polymer science, and biological sciences.
Handbook of Aggregation-Induced Emission, Volume 1 — читать онлайн ознакомительный отрывок
Ниже представлен текст книги, разбитый по страницам. Система сохранения места последней прочитанной страницы, позволяет с удобством читать онлайн бесплатно книгу «Handbook of Aggregation-Induced Emission, Volume 1», без необходимости каждый раз заново искать на чём Вы остановились. Поставьте закладку, и сможете в любой момент перейти на страницу, на которой закончили чтение.
Интервал:
Закладка:
In 2018, Sada et al. [58] disclosed the RDBR process of disubstituted TPE derivatives TPE‐2OMe and TPE‐2F through a combination of photochemical experiments and theoretical computations. As shown in Figure 3.31, E ‐ or Z ‐rich isomers exhibited EZI behavior after the solution was exposed to UV irradiation. Photostationary state approached in four hours under a deep‐ultraviolet (deep‐UV) lamp irradiation (6.2 mW/cm 2) or in 48 hours under ambient light. Furthermore, the solution in dark conditions or the solid under a deep‐UV lamp did not show EZI phenomenon, revealing that the EZI process was triggered by UV irradiation and was suppressed in the aggregated state. However, no photocyclization was observed in 1H NMR measurements, indicating that isomerization was indeed contained in the fluorescence measurement process, rather than the photocyclization.
The more detailed process was simulated by calculating the steepest‐descent (SD) pathways in the S 1states for E ‐ or Z ‐isomer, starting from the FC structures. Along the SD pathways, the rotational motion around the central double bond leads to the perpendicular structure. As the change of the TPE structure, the S 1energy gradually decreased and the S 0energy increased accordingly. Eventually, the S 1and S 0energies came to the closest when the double bond twisted about 90°, suggesting the existence of a CI near that place (see Figure 3.32).
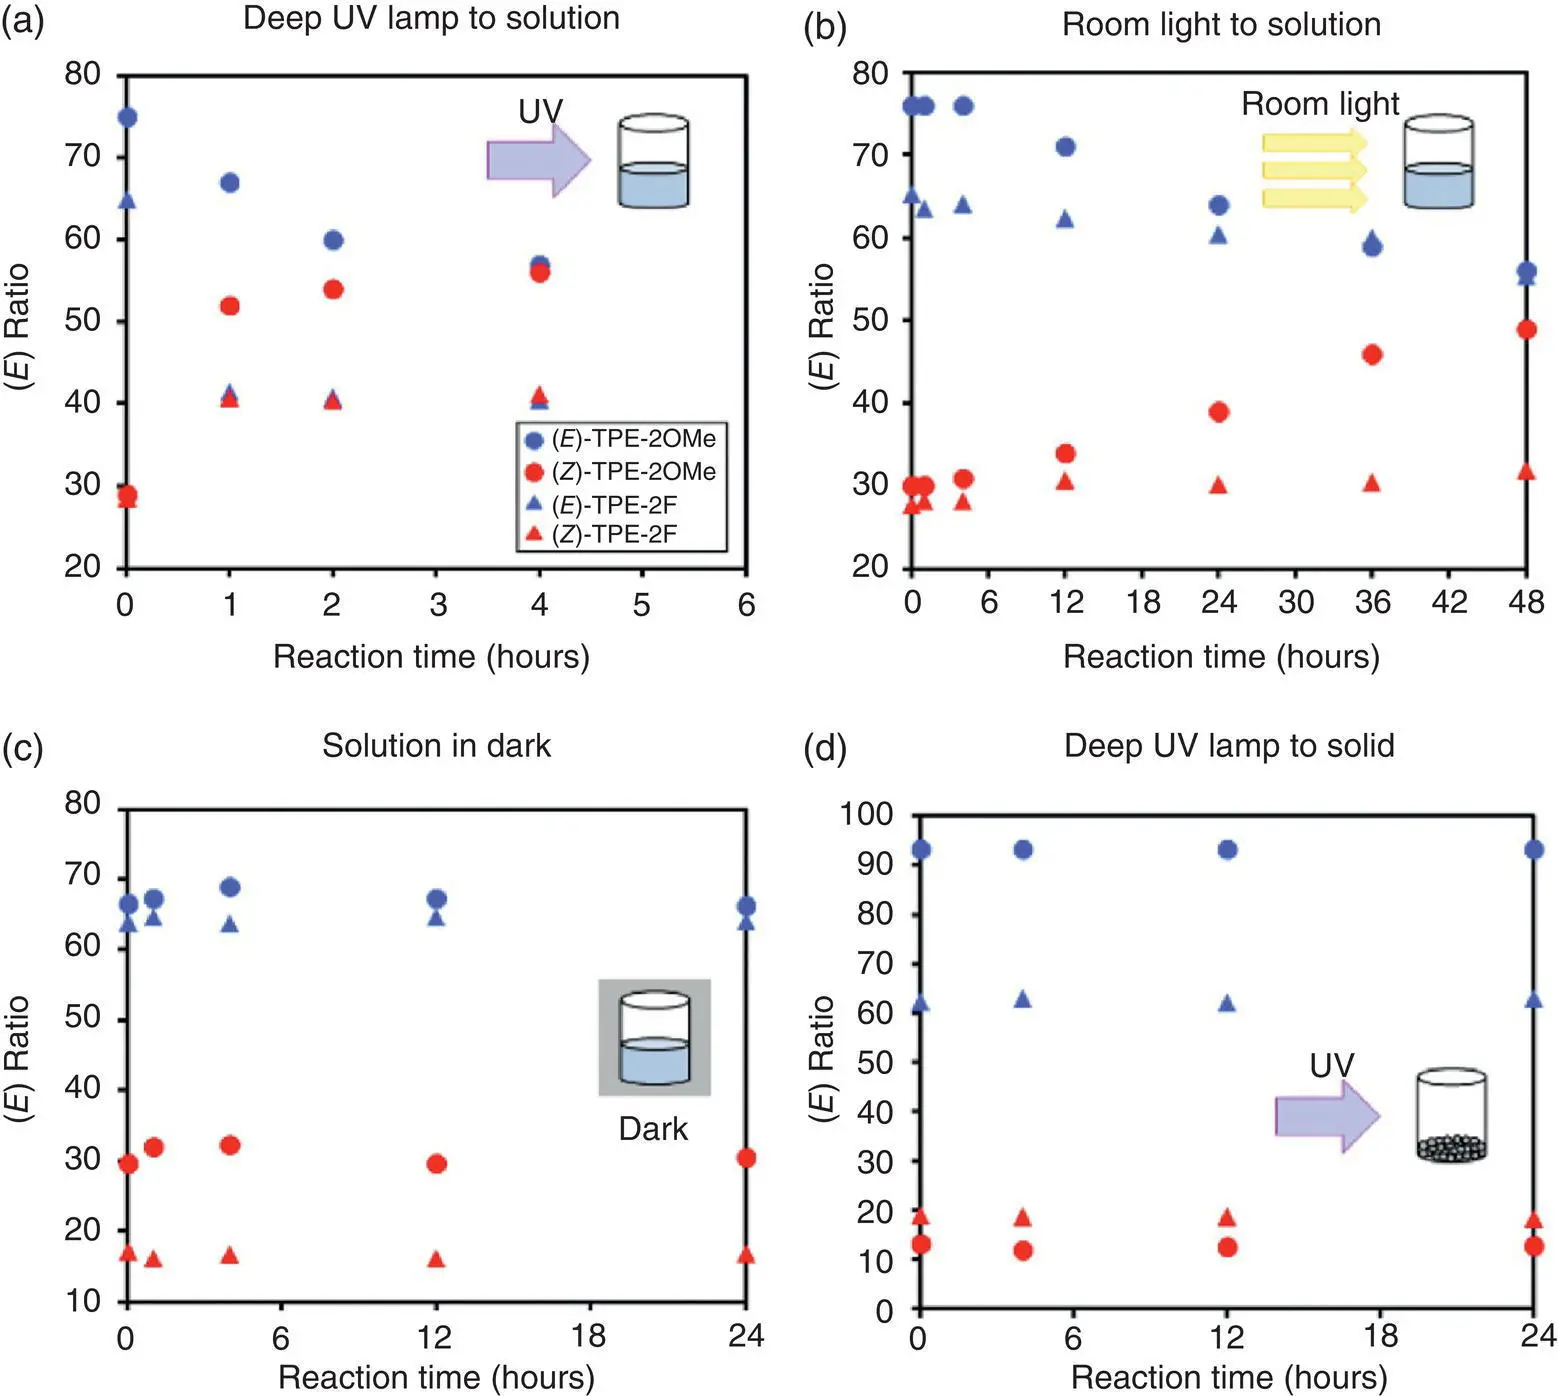
Figure 3.31 (a−c) Photoisomerization of TPE‐2OMe and TPE‐2F in chloroform (a) under deep‐UV lamp irradiation, (b) under ambient‐light irradiation, and (c) in the dark. (d) Photoisomerization of TPE‐2OMe and TPE‐2F in the solid state.
Source: Reproduced with permission from Ref. [58]. Copyright 2017, American Chemical Society.
In addition to free TPE‐2OMe monomer, the behavior in the crystal state was also simulated. From the crystal computational results, the torsion of the double bond was strictly inhibited by the other surrounding molecules, leading to only an 8° change of twisting angle. However, the twist of phenyl rings in the crystal state was identical to that of monomer in the excited state because the dihedral angle of the phenyl ring showed a similar variation (63° at S 0min→ 45° at S 1min). This revealed that the double bond rotation triggered by photoirradiation rather than the phenyl ring rotation played a key role on the AIE effect.
3.2.5 Other AIEgens Involving RBDR Process
In addition to TPE, there are many other AIEgens with a double bond, in which the RDBR process is also involved in their luminescence emission.
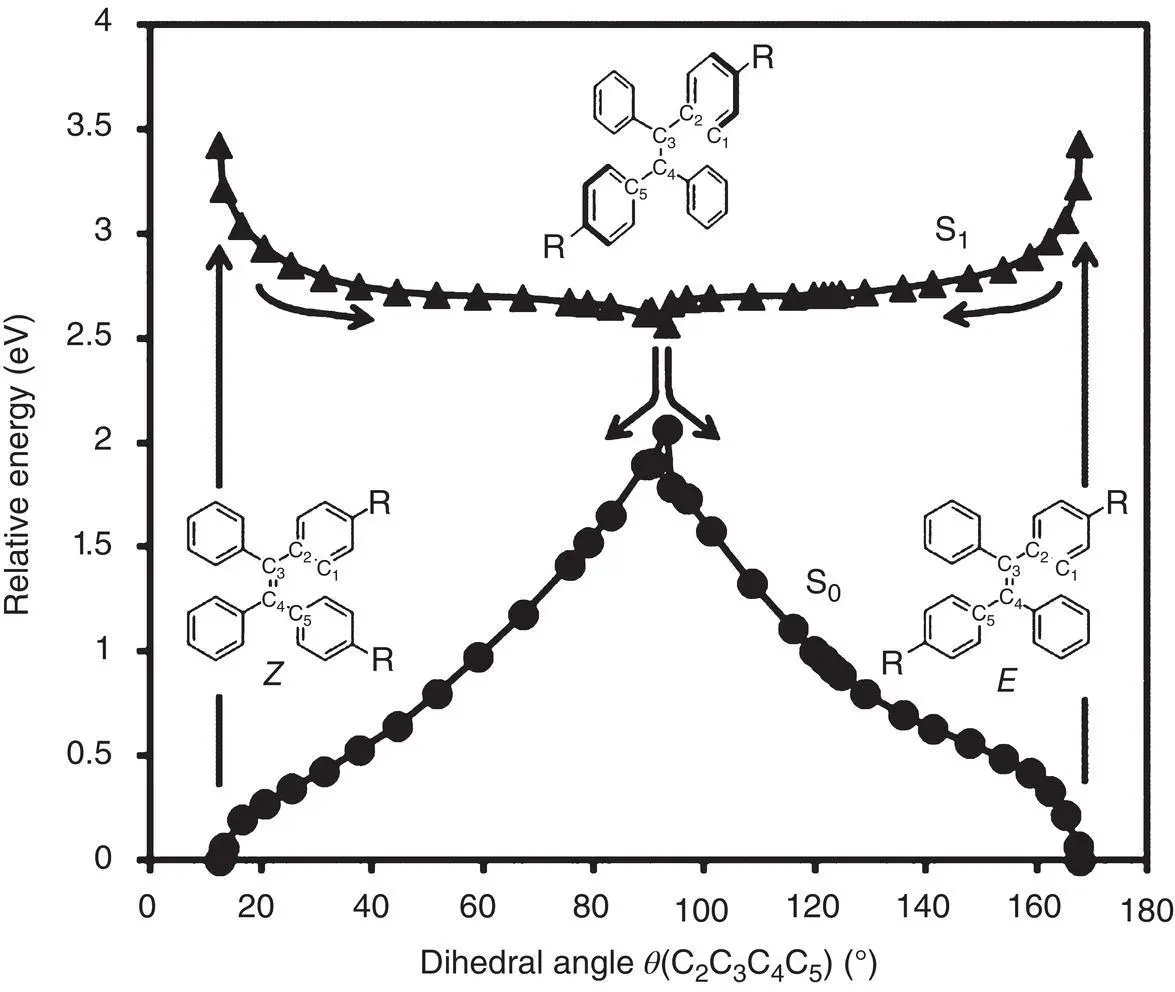
Figure 3.32 Energy variations of the S 1and S 0states along the steepest‐descent (SD) pathway in the S 1state of TPE‐2OMe.
Source: Reproduced with permission from Ref. [58]. Copyright 2017, American Chemical Society.
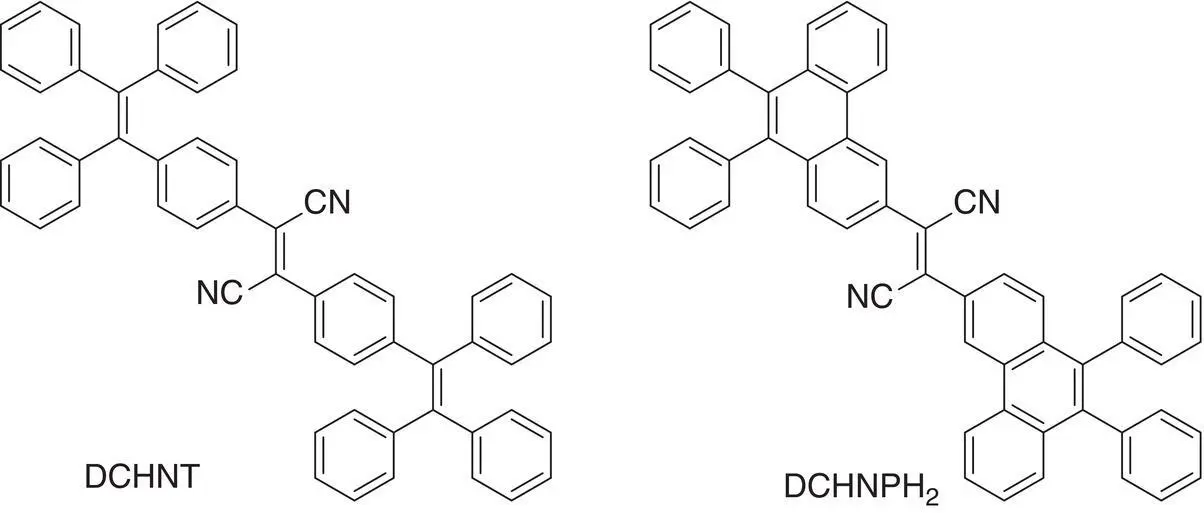
Figure 3.33 Molecular structures of dinitriles DCNT and DCNP.
Kobayashi et al. [59] prepared dinitriles DCNT and DCNP (see Figure 3.33) that exhibited AIE and isomerization properties. When the solution of their E ‐ or Z ‐isomer was exposed to a UV lamp, the central ethylenic bond substituted by cyano groups could rotate and result in photoisomerization and fluorescence quenching. In the packed state, no isomerization of them was observed on the same experimental conditions due to the locked conformation of the compounds, providing a bright emission.
The ( E )‐CN‐MBE is a typical AIEgen having great photophysical and self‐assembling characteristics, whose Φ fis dramatically enhanced almost 700‐fold from solution to aggregation [8]. But ( Z )‐CN‐MBE was the opposite, which emitted no fluorescence in both solution and aggregated states. Park et al. reported that the solid ( Z )‐CN‐MBE became intense emissive when it was exposed to a UV lamp under ambient temperatures due to the EZI process [60]. It was thought that the bent‐shape structure of ( Z )‐CN‐MBE led to loose packing, which was unable to effectively restrict the rotation of double bond even in the solid state. Therefore, nonradiative photoisomerization occurred. In contrary, the planar molecular structure of ( E )‐CN‐MBE was easier to form tight packing, effectively blocking the double bond rotation (see Figure 3.34).
This inference was confirmed by Yamamoto’s calculation results [61]. Electronic structural calculations were employed to analyze the mechanisms of AIE and photo/thermal E / Z isomerization of CN‐MBE. In addition to study the single‐point PE changing based on ethylenic bond rotation ( φ ) of isolated CN‐MBE, free energy (FE) including thermodynamic influence from the environment was also considered.
In the PE profile of CN‐MBE, it was revealed that isomerization from E ‐ ( φ = 180°) or Z ‐form ( φ = 0°) in the S 0state is difficult for CN‐MBE because of the large energy barrier (34 kcal/mol). However, in the S 1state, the torsional motion of the double bond reduced the energy from the vertically excited FC points of the E ‐ or Z ‐form to the minimum‐energy point ( φ = 90°) having no barrier. And the geometry corresponding to the minimum‐energy point of the conical intersection (MECI) between the S 0and S 1states of CN‐MBE demonstrated that the C═C bond had a significant twisting ( φ = 75°), indicating that the rotation around the ethylenic C=C bond of CN‐MBE was an important coordinate that led to the S 0/S 1CIs.
In the FE profile of CN‐MBE, both the solution state and crystal phase were calculated. In the THF solution (see Figure 3.35), no energy barrier existed in the FE profile of the S 1state from the vertically excited FC geometries of the E ‐ and Z ‐forms ( φ = 180 and 0°) to the twisted geometry ( φ = 90 °). The S 0/S 1CIs could be reached efficiently and facilitate fluorescence quenching after CN‐MBE photoexcitation; the molecule would show no emission when dispersed in dilute solutions.
In the crystal state, due to packing mode being different for two isomers, the simulation crystal structure of two forms of CN‐MBE showed that fractional free volumes of the E ‐ and Z ‐forms of CN‐MBE were found to be 22.1 and 24.2%, respectively, which indicated that the E ‐forms were more densely packed than the Z ‐forms in the aggregated phase.
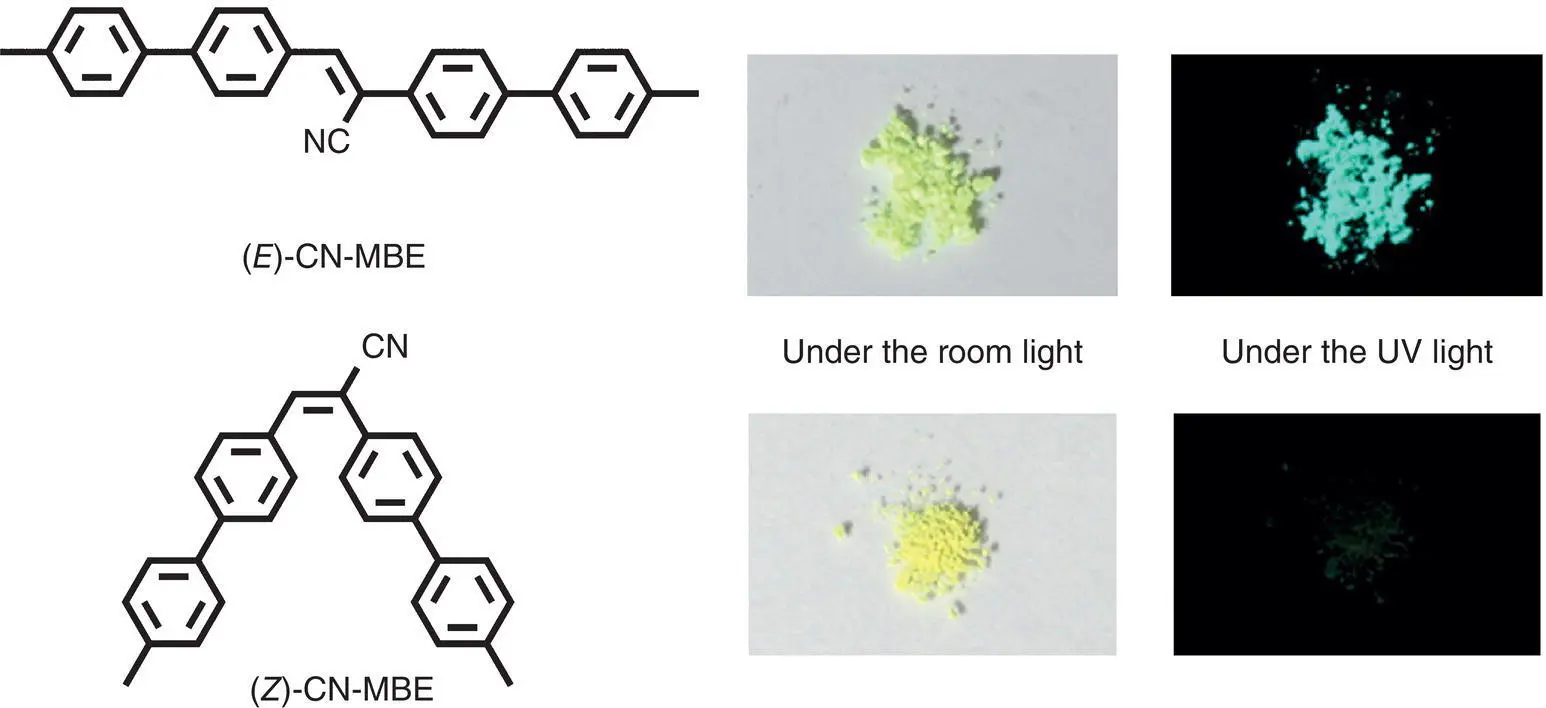
Figure 3.34 Photos of ( E )‐ (above) and ( Z )‐CN‐MBE (below) under room light and UV light.
Source: Reproduced with permission from Ref. [60]. Copyright 2013, American Chemical Society.
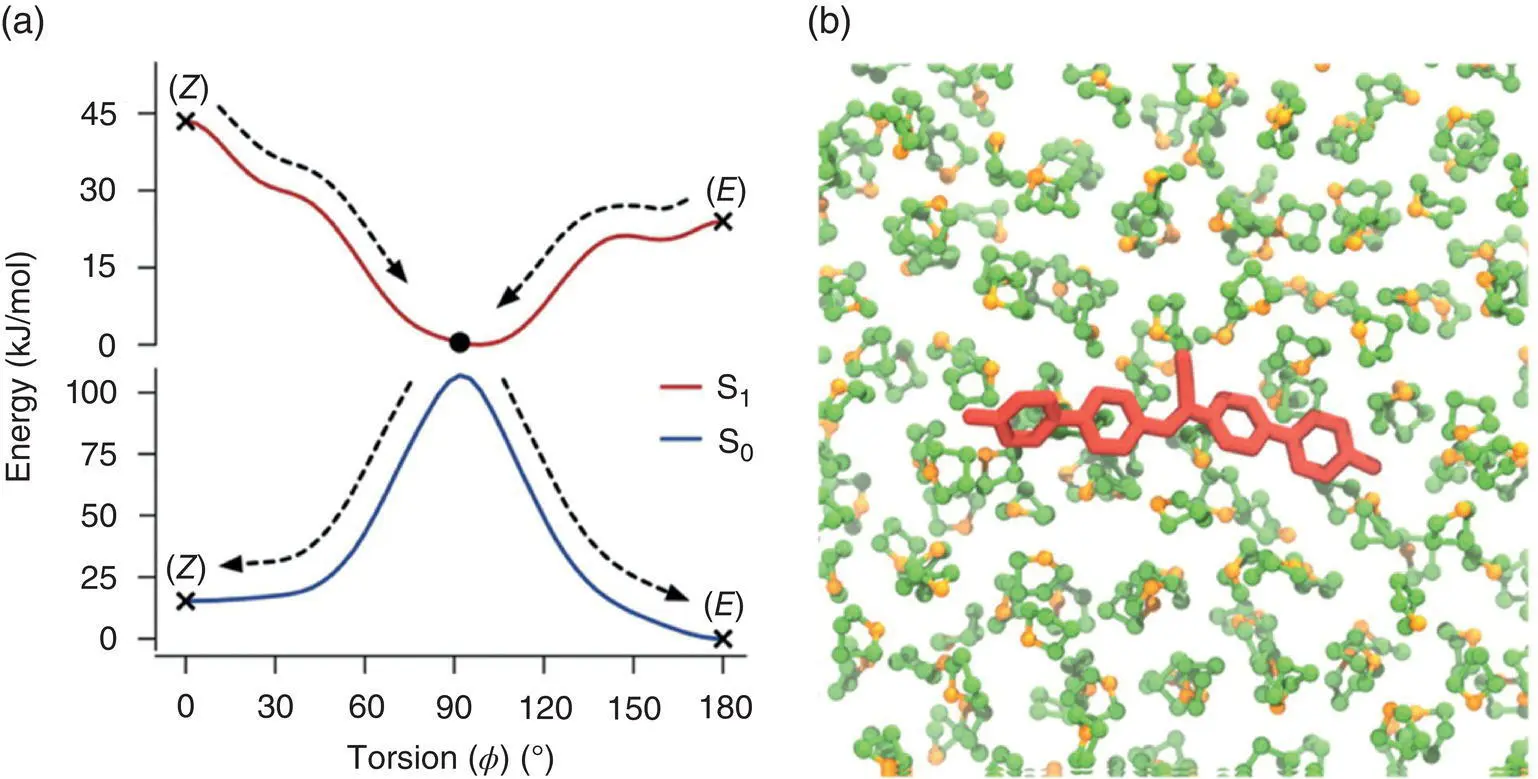
Figure 3.35 (a) Free‐energy profile of the changes in the torsional angle ( φ ) of the ethylenic C═C bond site of CN‐MBE in THF solution. (b) CN‐MBE in THF obtained from MD simulations.
Читать дальшеИнтервал:
Закладка:
Похожие книги на «Handbook of Aggregation-Induced Emission, Volume 1»
Представляем Вашему вниманию похожие книги на «Handbook of Aggregation-Induced Emission, Volume 1» списком для выбора. Мы отобрали схожую по названию и смыслу литературу в надежде предоставить читателям больше вариантов отыскать новые, интересные, ещё непрочитанные произведения.


Обсуждение, отзывы о книге «Handbook of Aggregation-Induced Emission, Volume 1» и просто собственные мнения читателей. Оставьте ваши комментарии, напишите, что Вы думаете о произведении, его смысле или главных героях. Укажите что конкретно понравилось, а что нет, и почему Вы так считаете.