Handbook of Aggregation-Induced Emission, Volume 1
Здесь есть возможность читать онлайн «Handbook of Aggregation-Induced Emission, Volume 1» — ознакомительный отрывок электронной книги совершенно бесплатно, а после прочтения отрывка купить полную версию. В некоторых случаях можно слушать аудио, скачать через торрент в формате fb2 и присутствует краткое содержание. Жанр: unrecognised, на английском языке. Описание произведения, (предисловие) а так же отзывы посетителей доступны на портале библиотеки ЛибКат.
- Название:Handbook of Aggregation-Induced Emission, Volume 1
- Автор:
- Жанр:
- Год:неизвестен
- ISBN:нет данных
- Рейтинг книги:3 / 5. Голосов: 1
-
Избранное:Добавить в избранное
- Отзывы:
-
Ваша оценка:
Handbook of Aggregation-Induced Emission, Volume 1: краткое содержание, описание и аннотация
Предлагаем к чтению аннотацию, описание, краткое содержание или предисловие (зависит от того, что написал сам автор книги «Handbook of Aggregation-Induced Emission, Volume 1»). Если вы не нашли необходимую информацию о книге — напишите в комментариях, мы постараемся отыскать её.
A thorough introduction to the mechanistic understanding of the importance of molecular motion to aggregation-induced emission An exploration of the aggregation-induced emission mechanism at the molecular level Practical discussions of aggregation-induced emission from the restriction of double bond rotation at the excited state, and clusterization-triggered emission Perfect for academic researchers working on aggregation-induced emission, this set of volumes is also ideal for professionals and students in the fields of photophysics, photochemistry, materials science, optoelectronic materials, synthetic organic chemistry, macromolecular chemistry, polymer science, and biological sciences.
Handbook of Aggregation-Induced Emission, Volume 1 — читать онлайн ознакомительный отрывок
Ниже представлен текст книги, разбитый по страницам. Система сохранения места последней прочитанной страницы, позволяет с удобством читать онлайн бесплатно книгу «Handbook of Aggregation-Induced Emission, Volume 1», без необходимости каждый раз заново искать на чём Вы остановились. Поставьте закладку, и сможете в любой момент перейти на страницу, на которой закончили чтение.
Интервал:
Закладка:
Table 2.6 Calculated room‐temperature k ic(s −1) for nondeuterated (H‐all) and fully deuterated (D‐all) isotopomers of the AIEgens and nonAIEgens in both solution and solid phases.
Source: © 2016 Royal Society of Chemistry [64].
| Solution | Solid | Solution | Solid | Solution | Solid | |
|---|---|---|---|---|---|---|
| HPS | BtTPS | HPDMCb | ||||
| H‐all | 2.44 × 10 11 | 8.58 × 10 6 | 2.20 × 10 11 | 2.73 × 10 7 | 1.31 × 10 11 | 2.26 × 10 7 |
| D‐all | 2.22 × 10 11 | 2.61 × 10 6 | 1.97 × 10 11 | 6.89 × 10 6 | 1.27 × 10 11 | 7.11 × 10 6 |
| IE | –9.0% | –69.6% | –10.5% | –74.8% | –3.1% | –68.5% |
| TPBD | DPTDTP | BPS | ||||
| H‐all | 2.16 × 10 10 | 4.21 × 10 6 | 1.79 × 10 9 | 6.76 × 10 5 | 1.13 × 10 10 | 2.19 × 10 9 |
| D‐all | 1.96 × 10 10 | 2.77 × 10 5 | 1.61 × 10 9 | 2.23 × 10 5 | 7.05 × 10 9 | 1.44 × 10 9 |
| IE | –9.3% | –93.4% | –10.1% | –67.0% | –37.6% | –34.2% |
| Perylene | DSB | Anthracene | ||||
| H‐all | 1.19 × 10 3 | 0.61 × 10 3 | 3.84 × 10 3 | 5.51 × 10 3 | 0.81 × 10 3 | 5.25 × 10 3 |
| D‐all | 0.29 × 10 3 | 0.18 × 10 3 | 1.04 × 10 3 | 0.66 × 10 3 | 0.23 × 10 3 | 1.05 × 10 3 |
| IE | –75.6% | –70.5% | –72.9% | –88.0% | –71.6% | –80.0% |
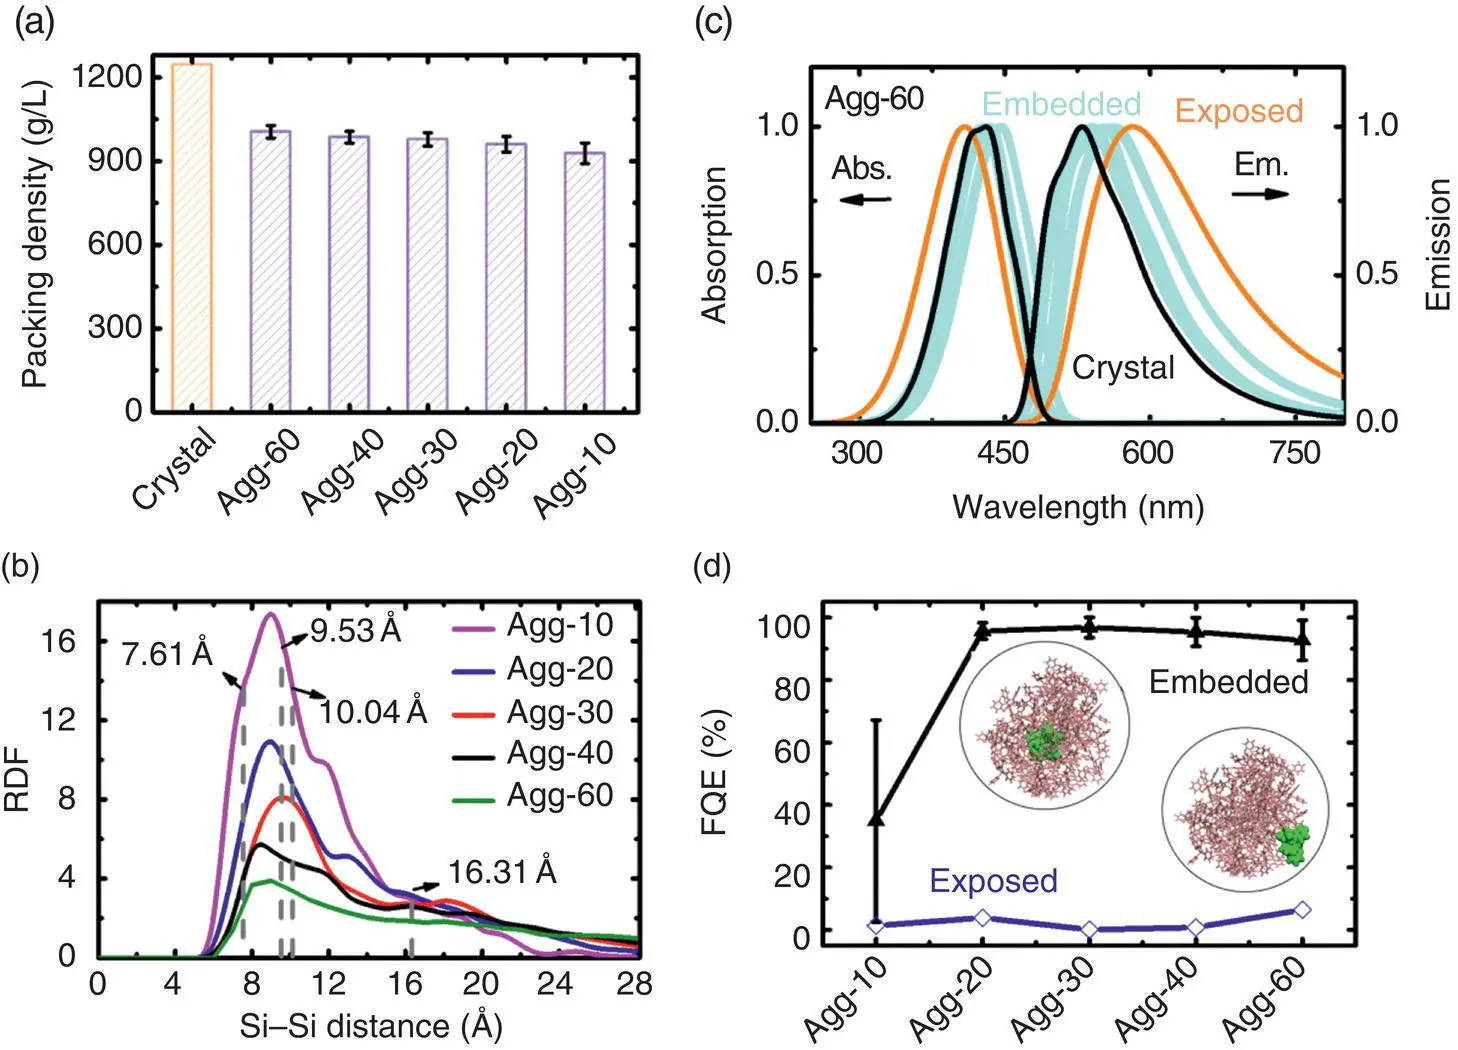
Figure 2.8 (a) The average packing density of amorphous HPS aggregates. (b) The average RDFs as a function of the intermolecular Si–Si distance. The lattice constants of the HPS crystal and the intermolecular distance of two HPS molecules in the unit cell are shown by dashed lines for comparison. (c) The calculated absorption (left) and emission (right) spectra for five embedded and one exposed HPS for aggregates with size 60. (d) Φ Fof five embedded and one exposed HPS molecule in amorphous aggregates with different sizes.
Source: Reproduced from Ref. [70]. Copyright 2016 The Royal Society of Chemistry.
2.4.5 Pressure‐induced Enhanced Emission (PIEE)
As discussed above, the electron–vibration and vibration–vibration couplings are sensitive to molecular packing. If so, they are sure to further decouple to larger extent under external pressure because of the more densely molecular packing and then enhancing the solid‐phase fluorescent emission, called pressure‐induced emission enhancement (PIEE) [71–73]. Take HPS [37] as an example; the mechanism behind PIEE was studied by combining DFT‐D crystalline‐structure simulations, QM/MM, and TVCF formalism [74]. It is found that upon compression, the volume is continuously reduced, and the intermolecular C–H … π hydrogen bond, steric hindrance, and π – π interactions are increased accordingly. The torsional motions of phenyl rings at the 2,5‐positions are firstly hindered from 5.06 to 10.86 GPa and then slightly active as pressure increases. As expected, with the increase of the pressure, the reorganization energy λ g(e)is gradually decreased until it reaches a saturation value, while the intermolecular excitonic coupling ( J ) changes a little, and it is very small and would have no effect on the optical properties; see Figure 2.9a. More excitedly, the k icis expected to reduce quickly first when pressure increases from 0 to 5.06 GPa and then levels off beyond 5.06 GPa, as shown in Figure 2.9b. As expected, the k rof HPS is insensitive to pressure because it is not mainly controlled by the reorganization energy [13]. Accordingly, Φ Frises rapidly with pressure up to 5.06 GPa but tends to level off at higher pressures. The calculated results are well consistent with the experiments [71]. Overall, the PIEE fully supports the origin of the AIE mechanism proposed above.
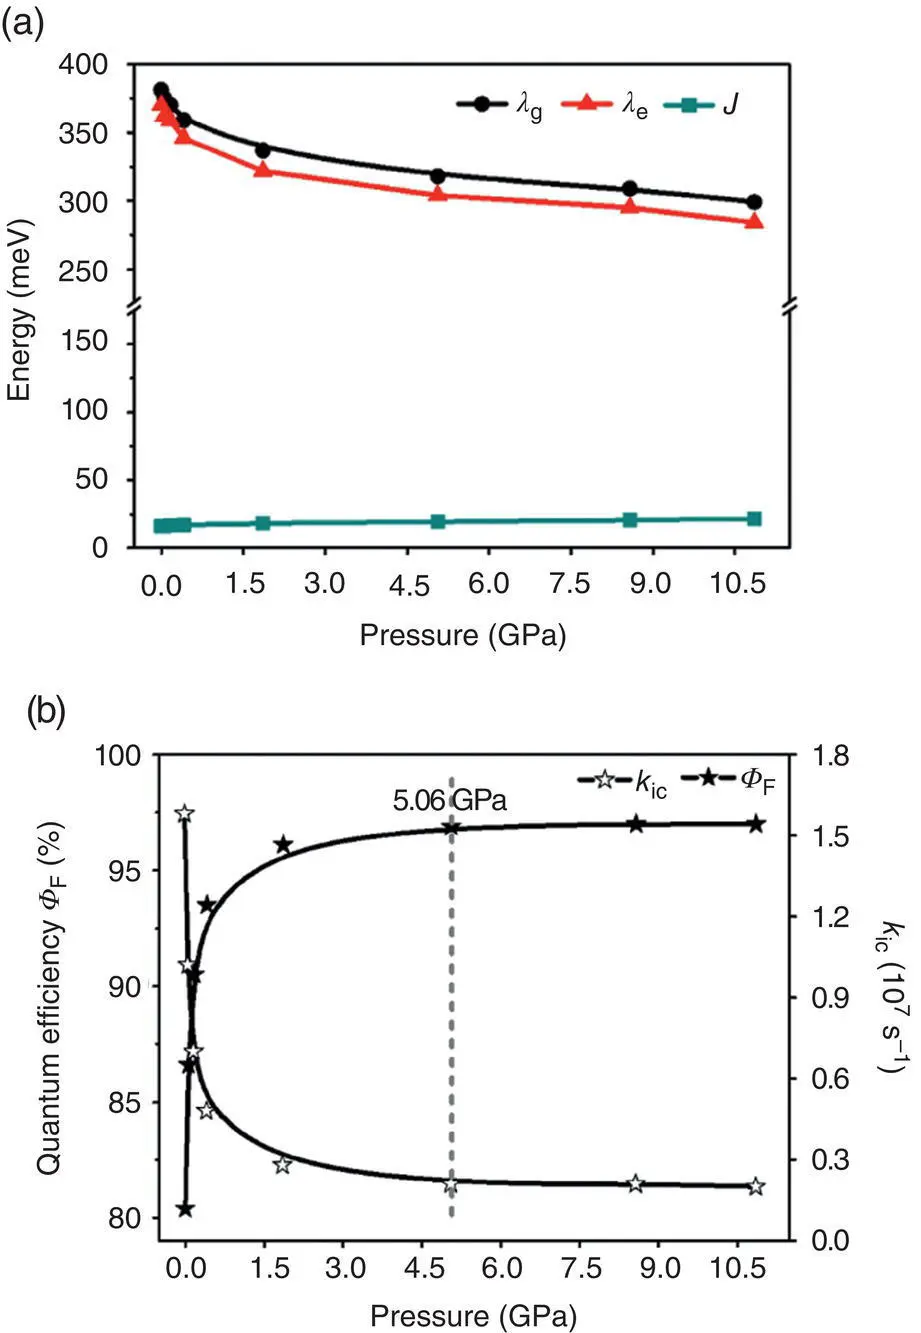
Figure 2.9 (a) Reorganization energies λ g(e)and excitonic couplings J of HPS in aggregates at different pressures. (b) Calculated k icand Φ Fof HPS in aggregates at different pressures.
Source: Reproduced from Ref. [74]. Copyright 2018 The Royal Society of Chemistry.
2.5 Molecular Design Based on AIE Mechanism
On the basis of the above proposed AIE mechanism, we further rationally design a series of AIE probes for specific biological applications. Two representative amphiphilic AIEgens, TTVP [75] and TTPy [76], with similar structures were chosen as examples ( Figure 2.3). As shown in Figure 2.3, the subtle difference in the chemical structures of them leads to dramatically different behavior in cell imaging. TTPy can penetrate the cell membrane and target mitochondria with excellent fluorescence imaging [76], while TTVP is able to specifically target and “light up” the lipid membrane [75]. Through a theoretical protocol combining large‐scale MD simulations and the hybrid QM/MM model, the mechanism behind their strikingly different fluorescence imaging behaviors was revealed [77]. The free‐energy profiles indicate that crossing the hydrophobic core of the lipid membrane, the free‐energy barrier for TTVP (30.44 kJ/mol) is much larger than that for TTPy (19.04 kJ/mol). The calculated permeability coefficient of TTPy (7.685 cm/s) is ca . 213 times larger than that of TTVP (3.612 × 10 −2cm/s), implying that TTPy could translocate through the lipid membrane and target mitochondria, while TTVP can target cell membrane.
As shown in Figure 2.10a, the QM/MM model of TTVP in the lipid membrane is set up to study its photophysical properties and to unravel the behind AIE mechanism. In both solution and lipid membrane, the quaternary 3‐(trimethylammonio)propyl group does not contribute to natural transition orbitals and thus no effect on the emission property ( Figure 2.10b, c). Upon excitation from S 0to S 1, the largest change of the dihedral angles is decreased from 24.8° to less than 4.7°, and the largest modification of the bond length is decreased from 0.07 to 0.02 Å ( Figure 2.10d, e), indicating the stronger rigidity of TTVP in the lipid membrane. The calculated k rand k icin the THF solution are 3.3 × 10 8and 2.4 × 10 10s −1, respectively; thus, Φ Fis 1.3%, consistent with the nonemissive phenomenon of TTVP in dilute THF solution. While in lipid membrane, k rof TTVP is about 3.6 × 10 8to 3.7×10 8s −1, which is a little bit larger than that in solution, in addition, the λ totalof TTVP in the lipid membrane is much smaller than that in solution; thus, k icin the lipid membrane should also be small ( Figure 2.10f). In addition, the emission of TTVP in the lipid membrane is blue‐shifted than in the THF solution ( Figure 2.10g), consistent with the experimental result [75]. That is to say, the enhancement of k rand the decrease of k icturn the fluorescence on in the lipid membrane. Thus, the design strategy of AIEgen‐based fluorescent probes proposed that it is amphiphilic AIEgens, including AIE‐featured tail group and head group with different positive charges, to target the lipid membrane or mitochondria selectively. According to the design principle, four amphiphilic AIEgens were designed. Two of the designed AIEgens are composed of the AIE‐core and pyridine group, having TTPy‐analogue characteristics, while the other two AIEgens are structurally similar to TTVP, considering the inclusion of a functional group with two positive charges. The cell image experiments indicate that the newly designed TTPy‐analogues can translocate through the cell membrane and target mitochondria, while the TTVP analogues can selectively light up the cell membrane. The experimental results verified the theoretical prediction.
Читать дальшеИнтервал:
Закладка:
Похожие книги на «Handbook of Aggregation-Induced Emission, Volume 1»
Представляем Вашему вниманию похожие книги на «Handbook of Aggregation-Induced Emission, Volume 1» списком для выбора. Мы отобрали схожую по названию и смыслу литературу в надежде предоставить читателям больше вариантов отыскать новые, интересные, ещё непрочитанные произведения.


Обсуждение, отзывы о книге «Handbook of Aggregation-Induced Emission, Volume 1» и просто собственные мнения читателей. Оставьте ваши комментарии, напишите, что Вы думаете о произведении, его смысле или главных героях. Укажите что конкретно понравилось, а что нет, и почему Вы так считаете.