Handbook of Aggregation-Induced Emission, Volume 1
Здесь есть возможность читать онлайн «Handbook of Aggregation-Induced Emission, Volume 1» — ознакомительный отрывок электронной книги совершенно бесплатно, а после прочтения отрывка купить полную версию. В некоторых случаях можно слушать аудио, скачать через торрент в формате fb2 и присутствует краткое содержание. Жанр: unrecognised, на английском языке. Описание произведения, (предисловие) а так же отзывы посетителей доступны на портале библиотеки ЛибКат.
- Название:Handbook of Aggregation-Induced Emission, Volume 1
- Автор:
- Жанр:
- Год:неизвестен
- ISBN:нет данных
- Рейтинг книги:3 / 5. Голосов: 1
-
Избранное:Добавить в избранное
- Отзывы:
-
Ваша оценка:
Handbook of Aggregation-Induced Emission, Volume 1: краткое содержание, описание и аннотация
Предлагаем к чтению аннотацию, описание, краткое содержание или предисловие (зависит от того, что написал сам автор книги «Handbook of Aggregation-Induced Emission, Volume 1»). Если вы не нашли необходимую информацию о книге — напишите в комментариях, мы постараемся отыскать её.
A thorough introduction to the mechanistic understanding of the importance of molecular motion to aggregation-induced emission An exploration of the aggregation-induced emission mechanism at the molecular level Practical discussions of aggregation-induced emission from the restriction of double bond rotation at the excited state, and clusterization-triggered emission Perfect for academic researchers working on aggregation-induced emission, this set of volumes is also ideal for professionals and students in the fields of photophysics, photochemistry, materials science, optoelectronic materials, synthetic organic chemistry, macromolecular chemistry, polymer science, and biological sciences.
Handbook of Aggregation-Induced Emission, Volume 1 — читать онлайн ознакомительный отрывок
Ниже представлен текст книги, разбитый по страницам. Система сохранения места последней прочитанной страницы, позволяет с удобством читать онлайн бесплатно книгу «Handbook of Aggregation-Induced Emission, Volume 1», без необходимости каждый раз заново искать на чём Вы остановились. Поставьте закладку, и сможете в любой момент перейти на страницу, на которой закончили чтение.
Интервал:
Закладка:
Source: © 2014 Royal Society of Chemistry.
| Unit: eV | Absorption | Emission | Stokes shift | Reorganization energy | ||||||
|---|---|---|---|---|---|---|---|---|---|---|
 |
 |
 |
 |
 |
 |
κ sol | κ agg |  |
 |
|
| DSA [57] | 2.82 | 2.75 | 0.07 | 2.18 | 2.01 | 0.17 | 0.74 | 0.64 | 0.74 | 0.64 |
| DCDPP [57] | 3.36 | 3.24 | 0.12 | 2.53 | 2.19 | 0.34 | 1.05 | 0.83 | 1.05 | 0.83 |
| TPBD [57] | 3.72 | 3.55 | 0.17 | 2.98 | 2.51 | 0.47 | 1.04 | 0.74 | 1.03 | 0.73 |
Table 2.5 Calculated k r, k ic, and Φ Fin both solution and aggregate phases at room temperature for HPDMCb and DCPP, respectively.
| k r(s −1) | k ic(s −1) | Φ F(%) | k r(s −1) | k ic(s −1) | Φ F(%) | |
|---|---|---|---|---|---|---|
| In isolated state | In solid phase | |||||
| HPDMCb [61] | 8.64 × 10 7 | 1.31 × 10 11 | 0.07 | 7.95 × 10 7 | 2.29 × 10 7 | 78.0 |
| DCPP [61] | 7.98 × 10 6 | 1.01 × 10 6 | 88.8 | 3.30 × 10 6 | 0.61 × 10 6 | 84.4 |
2.4.3 Isotope Effect vs DRE
Isotope effect (IE) has been widely applied to probe the excited‐state decay process [62, 63]. For conventional luminogens, deuteration always causes the remarkable decrease of k icwhile almost has no effect on k r, leading to greatly increased Φ F. It is easy to understand because under the displaced harmonic oscillator model based on FGR, k icis proportional to  when assuming one average accepting‐mode approximation, in which S denotes the Huang–Rhys factor and is determined by normal mode reorganization energy S = λ / ℏ . The reorganization energy can be obtained from the calculated excitation energies at the equilibrium geometries of S 0and S 1( λ = Δ E S1 − geom− Δ E S0 − geom), which is independent of isotopic substitution owing to the same equilibrium geometries and electronic‐state energy after deuteration. Thus, the decrease of frequency
  by deuteration implies the increase of S j, which largely decreases k icowing to the exponentially proportional relation between k icand – S mentioned above. It should be known that the conventional luminogens have little DRE for their planar and rigid geometries and the above approximation is suitable for them. While for flexible AIEgens with rotational groups in solution, beyond the displaced harmonic oscillator model, the mixing of different vibrational modes (so‐called DRE) must be considered in k ic. The DRE always occurs among low‐frequency modes, thus becoming more serious for much more active low‐frequency modes after deuteration, which sharply increases the k ic. Therefore, the deuteration gives rise to two competitive effects on k ic: the normal negative effect through increasing S jand the abnormally positive effect via the enhancement of DRE ( Figure 2.7a) [64]. Thus, it can also be easily understood that AIEgens exhibit normal negative IE because of the reduction of the electron–vibration coupling and vibration–vibration mixture upon aggregation. On the basis of the above, it is inferred that for AIEgens, a more remarkable IE exists in solid phase than in the solution phase, while for non‐AIEgens, high IE is expected to occur in both solid and solution phases. And we proposed that the IE can be used as a method to probe the AIE property of emitters and confirm the mixture of vibrational modes in the excited‐state decay process at the microscopic level.
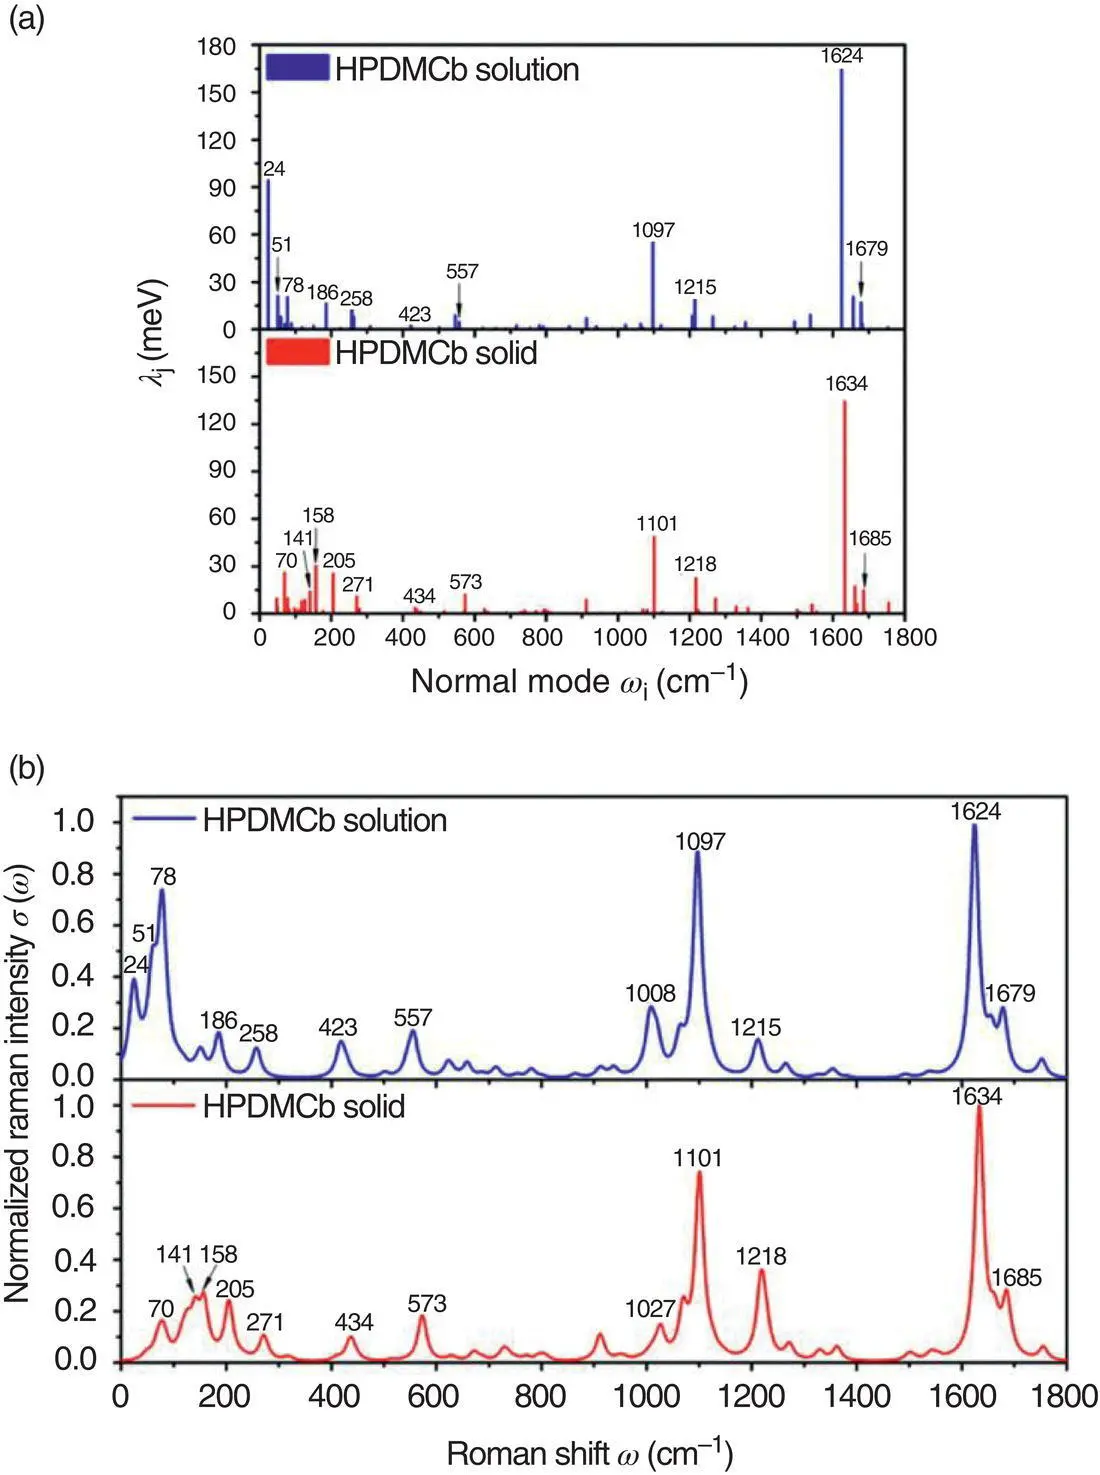
Figure 2.6 (a) Calculated λj versus ωj in both solution and solid phases for HPDMCb. (b) Calculated resonance Raman spectroscopy in both solution and solid phases for HPDMCb.
Source: Reproduced from Ref. [61]. Copyright 2015 American Chemical Society.
The k r, k ic, and IE of five AIEgens (HPS [37], BtTPS [65], HPDMCb [60], TPBD [56], and DPTDTP [66]) and four non‐AIEgens (BPS [67], perylene [68], DSB [69], and anthracene [68]) in both solution and solid states were calculated by combining the PCM and hybrid QM/MM models, respectively [64]. As shown in Table 2.6, it is found that the k icdecreases sharply by several orders of magnitude from the solution to solid phase for AIEgens but suffers a tiny change for non‐AIEgens. As shown in Figure 2.7b, it is found that (i) the IE for all cases is negative; (ii) for AIEgens, the IE is minor in solution (~10%) but becomes remarkable in solid phases (~65–95%); (iii) for non‐AIEgens, the IE results in both solution and solid phases are close to each other and fall in the range of −40 to −90%. The calculated isotopic characteristic of AIEgens is further verify by experiments for HPS before and after deuteration; the experimental IEs well reproduce the calculated results with very little IE in solution but remarkably in solid phase. Thus, the proposed IE scheme further verifies the AIE mechanism theoretically and experimentally in which the nonradiative decay channels are blocked greatly owing to the decoupling of vibration–vibration and electron–vibration and then turning the fluorescence on.
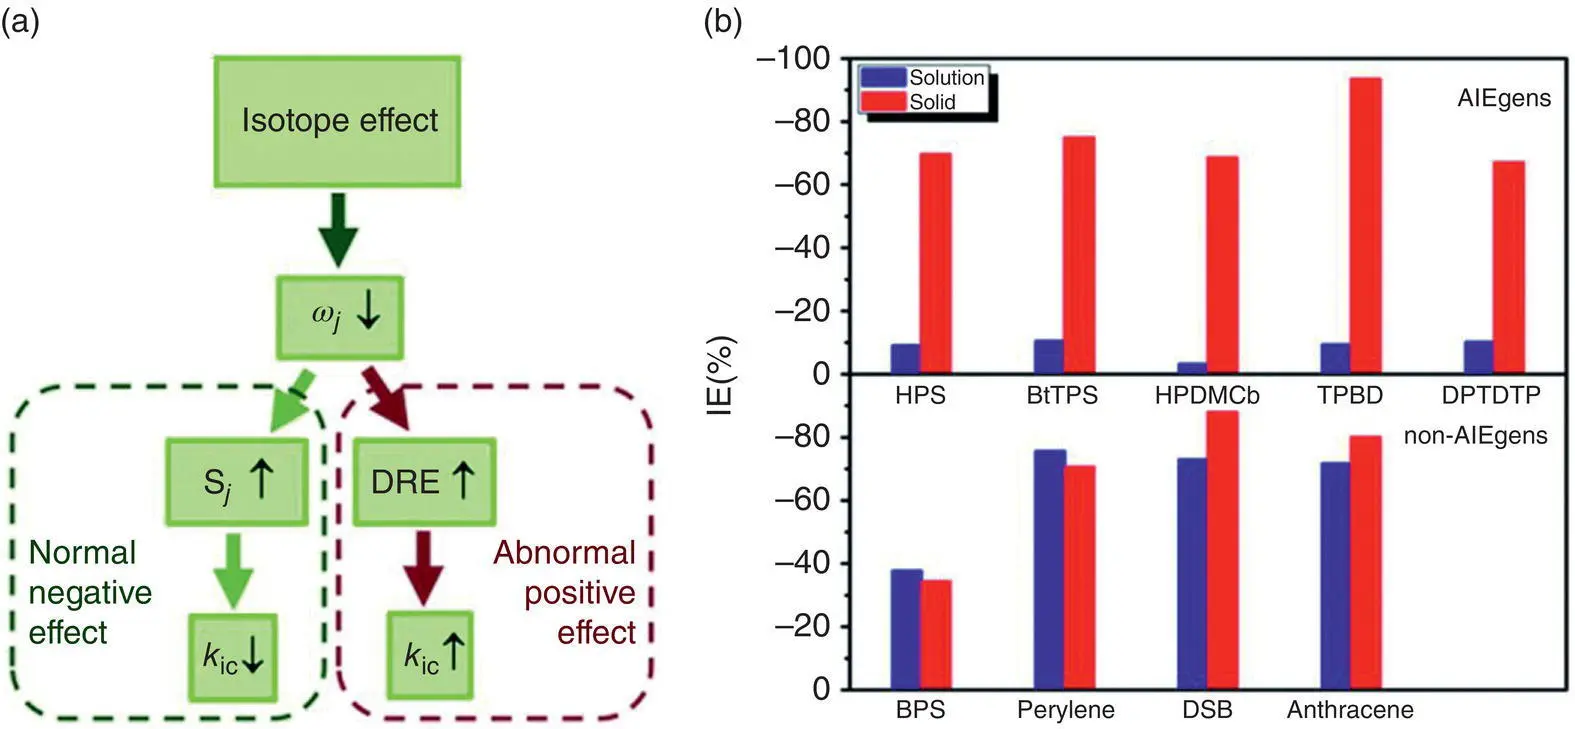
Figure 2.7 (a) Representation of the isotope effect on k ic. (b) IE results for AIEgens and non‐AIEgens.
Source: Reproduced from Ref. [64]. Copyright 2016 The Royal Society of Chemistry.
2.4.4 Linear Relationship between Fluorescence Intensity and Amorphous Aggregate Size
As the major existing form of AIEgens in experiments, the AIE mechanism of amorphous aggregate is rarely studied theoretically and is a great challenge because of their structural heterogeneity. Here, we proposed a theoretical protocol combining MD simulations and quantum mechanics/molecular mechanics calculations, and the TVCF spectrum and rate theory, to quantitatively investigate the AIE property in amorphous state and explore the relationship between molecular packing, optical spectra, and fluorescence quantum efficiency [70]. Take HPS [37] as an example; amorphous aggregates with five different sizes were set up in aqueous solution to demonstrate clearly the relationship between molecular packing, optical spectra, and Φ F, as well as their size effect. MD simulations indicate that HPS aggregates are generally near‐spherical and the packing density of aggregates is size‐independent and smaller than that of crystals ( Figure 2.8a, b). Due to the structural heterogeneity of the aggregates, AIEgen in amorphous aggregate could not be represented by an aggregate of the solely fixed conformation. Thus, at each size, five embedded and one exposed QM/MM models were set up for all sizes of aggregates. As shown in Figure 2.8c, the absorption of amorphous aggregates is similar to that of crystals, while the emission is clearly red‐shifted from the crystalline one. This can be explained by the lower‐packing‐density‐induced larger reorganization energies in amorphous HPS aggregates than that in crystal. Strikingly, Φ Fof the embedded HPS is size‐independent and about 1 or 2 orders of magnitude larger than those of the exposed ones (<7%), see Figure 2.8d. In addition, k ris insensitive to environments, k icis very sensitive to the environment, and k icof embedded HPS molecules are 2–4 orders of magnitude smaller than those of the exposed ones because of the restriction of the intramolecular low‐frequency rotational motions of embedded HPS molecules. More excitingly, the size‐independent Φ Fpredicts a linear relationship between the fluorescence intensity and aggregate size of the nanosized HPS aggregates. This indicates that the electron–vibration and vibration–vibration coupling are dependent on the compactness of molecular packing other than the size of the aggregate. In addition, the crystallization‐enhanced emission phenomenon in the experiment can be explained by the calculated blue‐shifted emission and enhanced fluorescence intensity of HPS from amorphous aggregate to the crystalline phase.
Читать дальшеИнтервал:
Закладка:
Похожие книги на «Handbook of Aggregation-Induced Emission, Volume 1»
Представляем Вашему вниманию похожие книги на «Handbook of Aggregation-Induced Emission, Volume 1» списком для выбора. Мы отобрали схожую по названию и смыслу литературу в надежде предоставить читателям больше вариантов отыскать новые, интересные, ещё непрочитанные произведения.


Обсуждение, отзывы о книге «Handbook of Aggregation-Induced Emission, Volume 1» и просто собственные мнения читателей. Оставьте ваши комментарии, напишите, что Вы думаете о произведении, его смысле или главных героях. Укажите что конкретно понравилось, а что нет, и почему Вы так считаете.