Handbook of Aggregation-Induced Emission, Volume 1
Здесь есть возможность читать онлайн «Handbook of Aggregation-Induced Emission, Volume 1» — ознакомительный отрывок электронной книги совершенно бесплатно, а после прочтения отрывка купить полную версию. В некоторых случаях можно слушать аудио, скачать через торрент в формате fb2 и присутствует краткое содержание. Жанр: unrecognised, на английском языке. Описание произведения, (предисловие) а так же отзывы посетителей доступны на портале библиотеки ЛибКат.
- Название:Handbook of Aggregation-Induced Emission, Volume 1
- Автор:
- Жанр:
- Год:неизвестен
- ISBN:нет данных
- Рейтинг книги:3 / 5. Голосов: 1
-
Избранное:Добавить в избранное
- Отзывы:
-
Ваша оценка:
Handbook of Aggregation-Induced Emission, Volume 1: краткое содержание, описание и аннотация
Предлагаем к чтению аннотацию, описание, краткое содержание или предисловие (зависит от того, что написал сам автор книги «Handbook of Aggregation-Induced Emission, Volume 1»). Если вы не нашли необходимую информацию о книге — напишите в комментариях, мы постараемся отыскать её.
A thorough introduction to the mechanistic understanding of the importance of molecular motion to aggregation-induced emission An exploration of the aggregation-induced emission mechanism at the molecular level Practical discussions of aggregation-induced emission from the restriction of double bond rotation at the excited state, and clusterization-triggered emission Perfect for academic researchers working on aggregation-induced emission, this set of volumes is also ideal for professionals and students in the fields of photophysics, photochemistry, materials science, optoelectronic materials, synthetic organic chemistry, macromolecular chemistry, polymer science, and biological sciences.
Handbook of Aggregation-Induced Emission, Volume 1 — читать онлайн ознакомительный отрывок
Ниже представлен текст книги, разбитый по страницам. Система сохранения места последней прочитанной страницы, позволяет с удобством читать онлайн бесплатно книгу «Handbook of Aggregation-Induced Emission, Volume 1», без необходимости каждый раз заново искать на чём Вы остановились. Поставьте закладку, и сможете в любой момент перейти на страницу, на которой закончили чтение.
Интервал:
Закладка:
2.4 Visualize Calculated Parameters in Experiments
As shown in Section 8.3, the theoretical calculation is an effective tool for unraveling the deep insights into experimental phenomenon; we know that the reorganization energy and DRE play important roles in the AIE mechanism; however, how to validate the theoretically proposed AIE mechanism and visualize the calculated parameters in experiments? In this section, we will bridge the calculated parameters and the experimental measurable parameters to validate our above proposed AIE mechanisms.
2.4.1 Stokes Shift vs Reorganization Energy
Three representative AIEgens, 9,10‐distyrylanthracene (DSA) [54], 2,3‐dicyano‐5,6‐diphenylpyrazine (DCDPP) [55], and cis , cis ‐1,2,3,4‐tetraphenyl‐1,3‐butadiene (TPBD) [56] in both solution phase (PCM model) and crystal (QM/MM model), were investigated at the PBE0‐D3(BJ)/6‐31G(d) level [57]. According to the Franck–Condon principle, the maximum peak of the optical spectrum usually appears at the vertical transition point ( Figure 2.5a); the Stokes shift ( κ ) between the absorption and emission maxima can be regarded as λ total, which is the sum of the reorganization energy of the ground ( λ gs) and excited state ( λ es). Then, the emission energy can be written as E em= E abs− λ total. Upon aggregate from solution, the shift of the emission spectrum can be regarded as:
(6) 
The common red‐shift spectra of the ACQ molecule originate from ΔE agg − sol< 0 for both absorption and emission and the tiny change in reorganization energy (  ). However, for AIEgens, the abnormally blue‐shifted emission occurs from the significant difference environments between the isolated molecule and aggregated phase. In AIEgens, the λ totalin the aggregate is usually much smaller than that in the solution phase, that is,
  , while in
  the absorption spectra of AIEgens in two phases are close to zero. As a result, the emission spectrum blue‐shifts with
  ; see Figure 2.5.
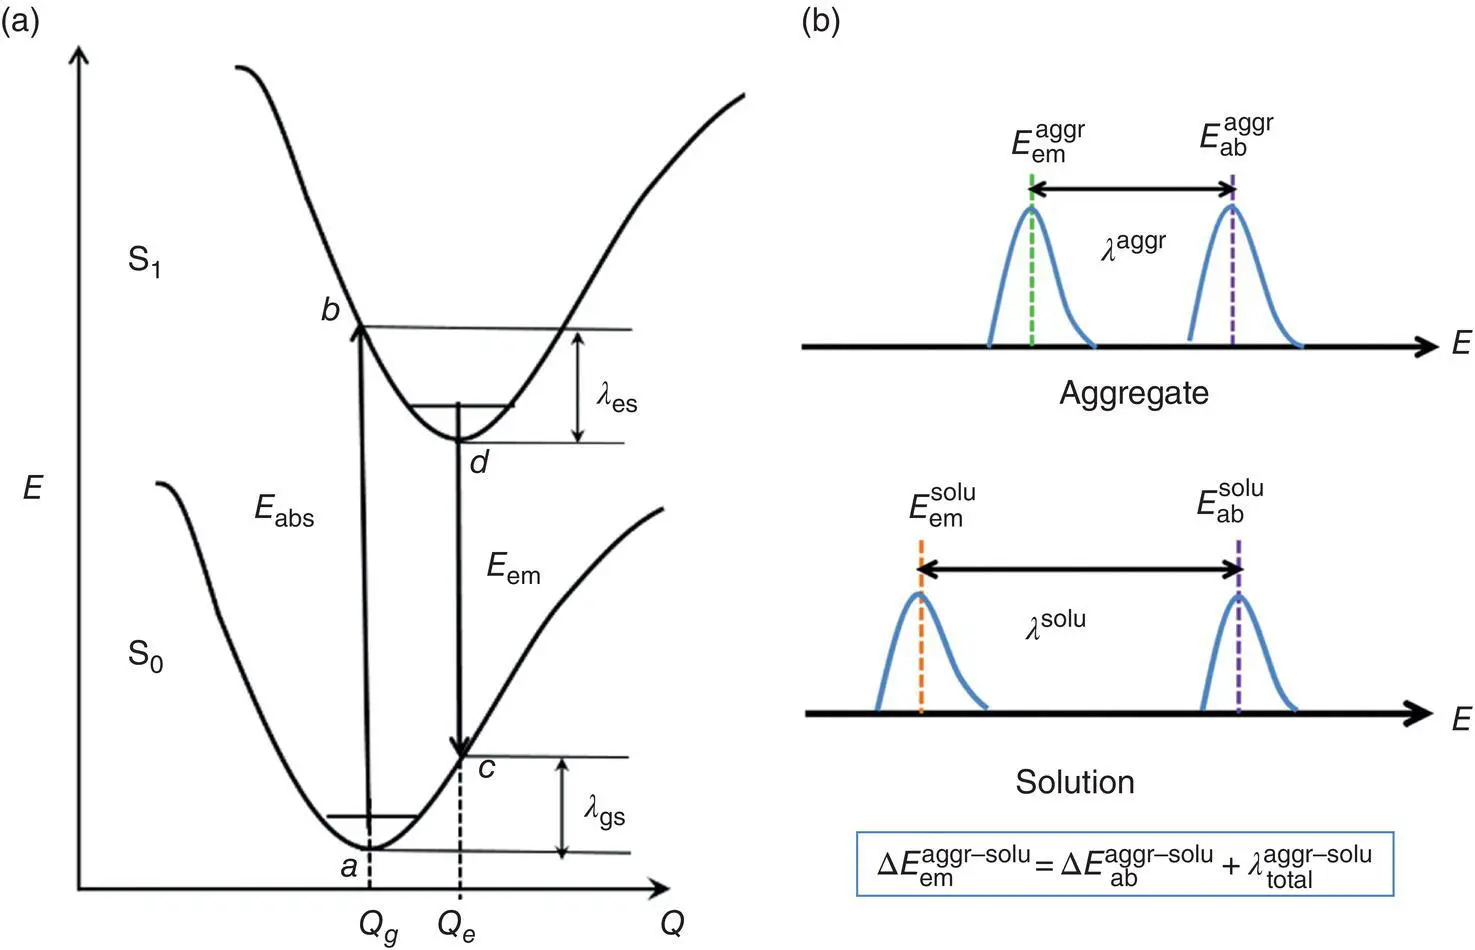
Figure 2.5 (a) The schematic representation of the adiabatic potential energy surface of the S0 and S1, as well as the corresponding vertical excitation energies. (b) The relative wavelength of AIEgen in both solution and aggregated state.
The optical properties and reorganization energies are summarized in Table 2.4. It is clear that, upon aggregation, the change of absorption spectra is tiny, while the emission spectra blue‐shifted obviously. Thus, the κ solis much larger than κ agg. According to the approximately equivalent relation between κ and λ total, as shown in Table 2.4,  is larger than
  . Thus, the blue‐shift emission is caused by the larger λ totalin solution than that in aggregate. Structural analysis and reorganization energy analysis reflect the key role of dihedral angles, and the restriction of low‐frequency rotational or twisting vibrations blocks the nonradiative decay channel and makes the light to emit.
2.4.2 Resonance Raman Spectroscopy (RSS) vs Reorganization Energy
Resonance Raman spectroscopy (RRS) is a spectroscopic technique in which the incident laser frequency is close to the electronic transition of chromophore. RRS is able to provide the information of excited‐state properties. Under the Franck−Condon approximation and resonance condition, the RRS intensity σ( ω j) from the j th normal mode is proportional to reorganization energy λ jtimes frequency ω j: σ ∝ ω j λ j→ σ / ω j∝ λ j[58, 59]. As discussed above, the reorganization energy is one key factor to determine k ic, which plays an important role in the AIE mechanism. In this part, we use RRS to detect the aggregation effect on the reorganization energy during the nonradiative process and validates the above‐proposed AIE mechanism.
The AIEgen HPDMCb [60] and AIE‐inactive DCPP [55] (see Figure 2.3) were chosen as models to show the connection between RRS intensity and the reorganization energy [61]. By combining PCM and QM/MM models, the photophysical properties of these two compounds were studied in both solution and solid phases. It is found that the k rof HPDMCb is similar in both phases; while k icdecreases by 4 orders of magnitude from 1.31 × 10 11to 2.29 × 10 7s −1upon aggregation, the corresponding Φ Fincreases to 78.0% from 0.07%, well consistent with the experimental results (see Table 2.5) [60]. For AIE‐inactive DCPP, the radiative and nonradiative decay rates and Φ Fare insensitive to the aggregation (see Table 2.5). Analyzing the three factors for the nonradiative decay rate, it is found that both the nonadiabatic coupling and adiabatic energy gap are almost unchanged for HPDMCb and DCPP. Moreover, the reorganization energy of DCPP has a little change from solution to solid phase. Thus, the excited‐state decay process of DCPP is independent on the surrounding environment. Much differently, the reorganization energy of HPDMCb is significantly reduced from solution to solid phase, as shown in Figure 2.6a, which leads to the large decrease of k icand the obvious increase of Φ Fin the solid phase. From Figure 2.6a, it is also seen that the frequencies of the low‐frequency modes (<100 cm −1) become ca . two to threefold larger upon aggregation; however, the reorganization energy of each mode reduces a lot. These suggest that the coupling between low‐frequency modes and the transition electrons is strongly decoupled upon aggregation, leading to the decrease of nonradiative decay rate. With the incident wavelength equal to the adiabatic excitation energy, the RRS plot of HPDMCb in both solution and solid phases is shown in Figure 2.6b, and the blue shift of the low‐frequency peaks with the relatively decreased RRS intensity fully reflects the change character of the reorganization energies. In addition, the high‐frequency normal modes are almost unresponsive to the environment, as shown in both reorganization energies and RRS signals for AIE‐active HPDMCb. Therefore, the above‐proposed AIE mechanism is successfully confirmed by RRS signals and the RRS can act as a good detection means of AIE property.
Table 2.4 The calculated spectral properties and reorganization energies corrected by zero‐point energy for DSA, DCDPP, and TPBD in solution and aggregate phase, respectively.
Читать дальшеИнтервал:
Закладка:
Похожие книги на «Handbook of Aggregation-Induced Emission, Volume 1»
Представляем Вашему вниманию похожие книги на «Handbook of Aggregation-Induced Emission, Volume 1» списком для выбора. Мы отобрали схожую по названию и смыслу литературу в надежде предоставить читателям больше вариантов отыскать новые, интересные, ещё непрочитанные произведения.


Обсуждение, отзывы о книге «Handbook of Aggregation-Induced Emission, Volume 1» и просто собственные мнения читателей. Оставьте ваши комментарии, напишите, что Вы думаете о произведении, его смысле или главных героях. Укажите что конкретно понравилось, а что нет, и почему Вы так считаете.