Tony Waters - Process Gas Chromatographs
Здесь есть возможность читать онлайн «Tony Waters - Process Gas Chromatographs» — ознакомительный отрывок электронной книги совершенно бесплатно, а после прочтения отрывка купить полную версию. В некоторых случаях можно слушать аудио, скачать через торрент в формате fb2 и присутствует краткое содержание. Жанр: unrecognised, на английском языке. Описание произведения, (предисловие) а так же отзывы посетителей доступны на портале библиотеки ЛибКат.
- Название:Process Gas Chromatographs
- Автор:
- Жанр:
- Год:неизвестен
- ISBN:нет данных
- Рейтинг книги:3 / 5. Голосов: 1
-
Избранное:Добавить в избранное
- Отзывы:
-
Ваша оценка:
Process Gas Chromatographs: краткое содержание, описание и аннотация
Предлагаем к чтению аннотацию, описание, краткое содержание или предисловие (зависит от того, что написал сам автор книги «Process Gas Chromatographs»). Если вы не нашли необходимую информацию о книге — напишите в комментариях, мы постараемся отыскать её.
Process Gas Chromatographs:
Fundamentals, Design and Implementation
Describes practical procedures for design and troubleshooting Contains concise chapters that provide a structured course for advanced students in process engineering Reviews the fundamentals of applied gas chromatography Details the operation and maintenance of process gas chromatographs Offers a summary, and self-assessment questions, for every chapter Is written by an international expert in the field with extensive industry knowledge and teaching experience in courses on process sampling systems and gas chromatography Written for process analyzer engineers and technicians, application engineers, and industrial environmental engineers, offers an essential guide to the basics of gas chromatography and reviews the applications of process gas chromatographs in industry today.
Process Gas Chromatographs — читать онлайн ознакомительный отрывок
Ниже представлен текст книги, разбитый по страницам. Система сохранения места последней прочитанной страницы, позволяет с удобством читать онлайн бесплатно книгу «Process Gas Chromatographs», без необходимости каждый раз заново искать на чём Вы остановились. Поставьте закладку, и сможете в любой момент перейти на страницу, на которой закончили чтение.
Интервал:
Закладка:
It's a long movie. The number of equilibria generated by a typical column ranges from about 5,000 to 50,000. Even a slow peak with a retention time of 1000 s would need to average one equilibrium every 50 ms to get 20,000 plates. That's equivalent to 20 movie frames per second − not a bad analogy!
With such a large number of data points, our jerky model is not so jerky after all. And it's a powerful way of evaluating column efficiency. We shall soon discover that having more equilibria in the column causes better separations.
There is a theoretical connection between the shape of a peak on the chromatogram and the number of times that equilibrium has occurred. Yes, we can figure the effective number of equilibria by measuring the resulting peak shape. This is yet another glimpse of the information buried in a chromatogram. We'll exhume it later.
A peak appears
An important thing just happened.
In Figure 2.4c, notice that the same percentage of the molecules dissolved in the liquid phase even when there were fewer molecules available; the solubility ratio is constant. In our example, for instance, we always end up with exactly half of the propane molecules dissolved in the liquid phase. Constant solubility is a very useful property of liquid phases because it generates symmetrical peak shapes. You are about to see how that happens.
There are some rare exceptions to the rule of constant solubility. When solubility varies with solute concentration, some adverse distortion of peak shape occurs that you will need to recognize when troubleshooting. This isn't the time to discuss the problem, so let's leave it for later.
In Figure 2.4there's only one small enclosed space where an equilibrium forms and is quickly disrupted by the movement of the carrier gas. Now imagine that a column has lots of these small enclosed spaces arranged in series, as depicted in Figure 2.5, so the gas leaving one of the spaces enters the next one, where it encounters fresh clean liquid. It then quickly forms a new equilibrium.
The upper diagram shows how the carrier gas movement carries the propane molecules into the next part of the column, where it encounters fresh liquid phase. The lower diagram imagines that the carrier gas stops for a moment to allow two equilibria to form, each one involving only half of the original molecules. 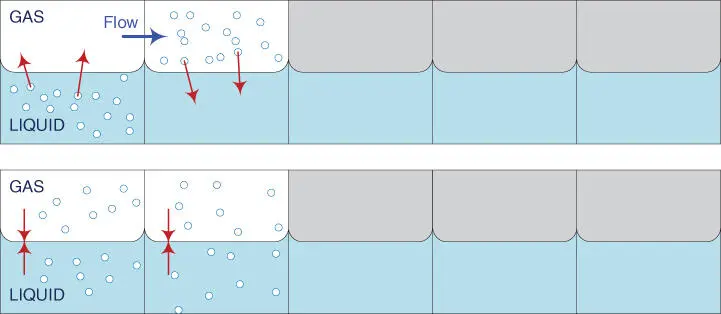
Figure 2.5The Second Equilibrium.
The lower section of Figure 2.5shows the first two of these equilibria side by side. So far, it's not very interesting because not much has happened; the original molecules have divided into four equal parts.
But they don't stay that way for long; again, the carrier gas moves. Figure 2.6shows this movement and the formation of the third equilibrium. Look closely at the third equilibrium. The distribution of the propane molecules in the gas phase is now 4:8:4. Already, a peak has appeared!
Again, the upper diagram shows the movement of the carrier gas, which carries all the propane molecules to the next part of the column. The lower diagram then shows how three new equilibria form, but the center one contains half of the original molecules. 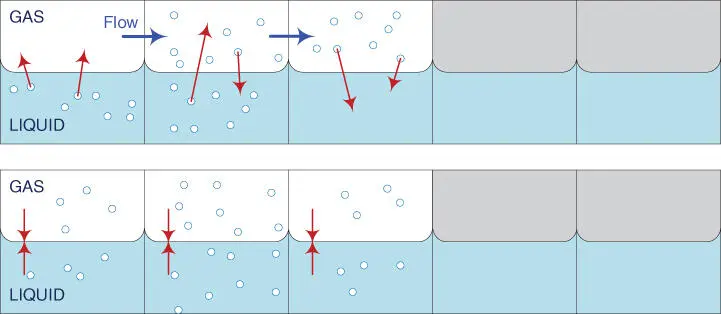
Figure 2.6The Third Equilibrium.
In Figure 2.7, the process continues and forms four new equilibria. Notice that each time the carrier gas moves, the number of molecules in the original small enclosed space is reduced by a factor of two. Clearly, if this same division recurs many times over, all those molecules will soon be gone − even if starting from a very large number of molecules.
Again, the upper diagram shows the movement of the carrier gas. The lower diagram then shows how four new equilibria form. Notice that each time the carrier gas moves, the molecule population in both the far left and far right equilibria divides by two and is rapidly disappearing. 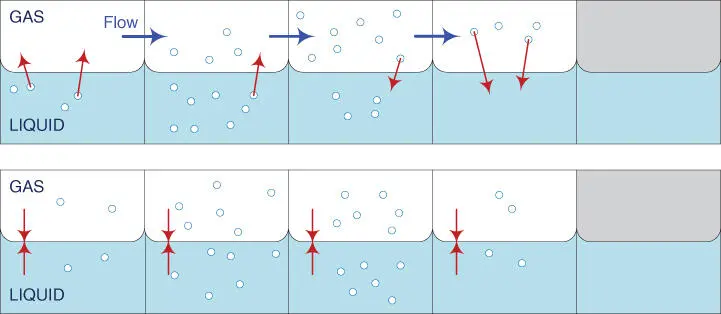
Figure 2.7The Fourth Equilibrium.
Notice also, that the same rapid reduction occurs in the leading edge of the band of molecules. This repetitive reduction of the number of molecules distant from the band center quickly focuses the molecules into a narrow symmetrical peak.
Finally, Figure 2.8shows how the stepwise motion of the carrier gas has gradually shaped the peak until it starts to look like a real chromatogram peak. Be sure to understand what's happening here.
Again, the upper diagram shows the movement of the carrier gas. The lower diagram then shows how five new equilibria form. The molecule distribution is now in the shape of a peak with the highest concentration of molecules at the center, and the lowest concentration at the edges. This is how real peaks form in columns. 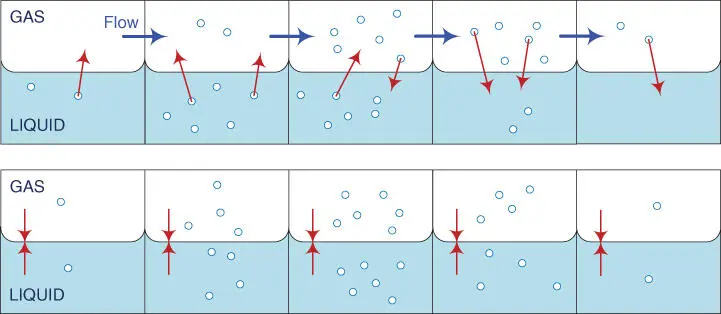
Figure 2.8The Fifth Equilibrium.
It's important to realize that the carrier gas present during the original sample injection has traveled down the column and is now in the fifth equilibrium. This progression of the carrier gas through the five equilibria is indicated by the white background color in Figures 2.5through 2.8.
By the time the carrier gas reaches the fifth equilibrium, most of the propane molecules have been left behind; only one stayed with the carrier gas during the five moves considered so far. The distribution of propane molecules in the gas phase is now 1:4:6:4:1, and the peak concentration is right at the middle. Notice that the average rate of movement of a propane molecule is half the speed of the carrier gas. If you are following closely, you'll realize why. The propane solubility is 50 %, so at any instant of time only half of the molecules are in the gas phase, moving. The other half are stationary.
Effect of more equilibria
Figure 2.9is a graphic rendering of the equilibrium model that tracks the movement of the propane molecules relative to the movement of the carrier gas. The solubility of the molecules is again assumed to be 50 %. The carrier movement represents the distance moved by carrier gas molecules that were present at the instant of sample injection.
Each colored trace shows the distribution of molecules and the corresponding peak shape obtained for a different number of equilibria (N). In practice, the narrower peaks would be much higher: the scale of the vertical axis is not the same for each trace. When a column operates under optimum conditions, a peak experiences more equilibria as it passes through the same length of column, resulting in narrower peaks that are easier to separate. 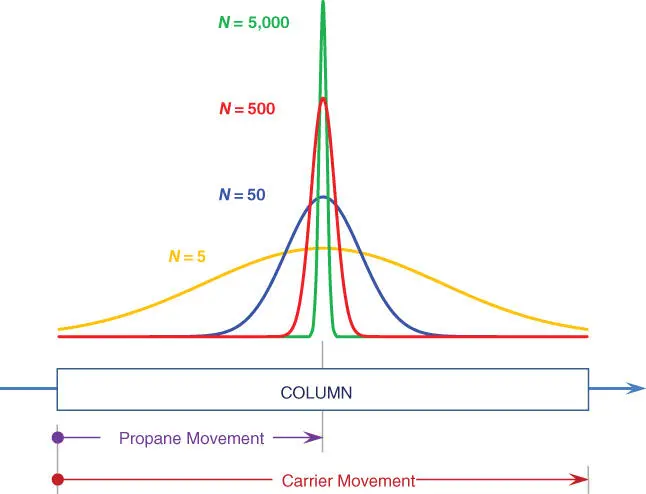
Figure 2.9Effect of Having More Equilibria.
The gold curve in Figure 2.9is a smoothed version of the 1:4:6:4:1distribution we obtained with five equilibria. This embryonic peak would appear in the first two millimeters of a regular packed column and would take less than one fourth of a second to form.
Continuing the jerky mechanism for more equilibria would be tedious, but luckily it can be done mathematically. Figure 2.9also displays the curves for 50, 500, and 5,000 equilibria, plotted as if they occurred along the same length of column. They look just like chromatogram peaks! And that's exactly what they are. You have just witnessed how the standard peak shape forms.
Читать дальшеИнтервал:
Закладка:
Похожие книги на «Process Gas Chromatographs»
Представляем Вашему вниманию похожие книги на «Process Gas Chromatographs» списком для выбора. Мы отобрали схожую по названию и смыслу литературу в надежде предоставить читателям больше вариантов отыскать новые, интересные, ещё непрочитанные произведения.


Обсуждение, отзывы о книге «Process Gas Chromatographs» и просто собственные мнения читателей. Оставьте ваши комментарии, напишите, что Вы думаете о произведении, его смысле или главных героях. Укажите что конкретно понравилось, а что нет, и почему Вы так считаете.