Samprit Chatterjee - Handbook of Regression Analysis With Applications in R
Здесь есть возможность читать онлайн «Samprit Chatterjee - Handbook of Regression Analysis With Applications in R» — ознакомительный отрывок электронной книги совершенно бесплатно, а после прочтения отрывка купить полную версию. В некоторых случаях можно слушать аудио, скачать через торрент в формате fb2 и присутствует краткое содержание. Жанр: unrecognised, на английском языке. Описание произведения, (предисловие) а так же отзывы посетителей доступны на портале библиотеки ЛибКат.

- Название:Handbook of Regression Analysis With Applications in R
- Автор:
- Жанр:
- Год:неизвестен
- ISBN:нет данных
- Рейтинг книги:3 / 5. Голосов: 1
-
Избранное:Добавить в избранное
- Отзывы:
-
Ваша оценка:
Handbook of Regression Analysis With Applications in R: краткое содержание, описание и аннотация
Предлагаем к чтению аннотацию, описание, краткое содержание или предисловие (зависит от того, что написал сам автор книги «Handbook of Regression Analysis With Applications in R»). Если вы не нашли необходимую информацию о книге — напишите в комментариях, мы постараемся отыскать её.
andbook and reference guide for students and practitioners of statistical regression-based analyses in R
Handbook of Regression Analysis
with Applications in R, Second Edition
The book further pays particular attention to methods that have become prominent in the last few decades as increasingly large data sets have made new techniques and applications possible. These include:
Regularization methods Smoothing methods Tree-based methods In the new edition of the
, the data analyst’s toolkit is explored and expanded. Examples are drawn from a wide variety of real-life applications and data sets. All the utilized R code and data are available via an author-maintained website.
Of interest to undergraduate and graduate students taking courses in statistics and regression, the
will also be invaluable to practicing data scientists and statisticians.
Handbook of Regression Analysis With Applications in R — читать онлайн ознакомительный отрывок
Ниже представлен текст книги, разбитый по страницам. Система сохранения места последней прочитанной страницы, позволяет с удобством читать онлайн бесплатно книгу «Handbook of Regression Analysis With Applications in R», без необходимости каждый раз заново искать на чём Вы остановились. Поставьте закладку, и сможете в любой момент перейти на страницу, на которой закончили чтение.
Интервал:
Закладка:
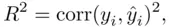
where
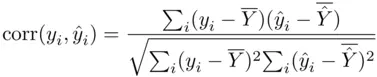
is the sample correlation coefficient between  and
and  (this correlation is called the multiple correlation coefficient). That is,
  is a direct measure of how similar the observed and fitted target values are.
It can be shown that  is biased upwards as an estimate of the population proportion of variability accounted for by the regression. The adjusted
  corrects this bias, and equals
(1.7) 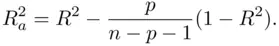
It is apparent from (1.7)that unless  is large relative to
  (that is, unless the number of predictors is large relative to the sample size),
  and
and  will be close to each other, and the choice of which to use is a minor concern. What is perhaps more interesting is the nature of
  as providing an explicit tradeoff between the strength of the fit (the first term, with larger
  corresponding to stronger fit and larger
  ) and the complexity of the model (the second term, with larger
  corresponding to more complexity and smaller
  ). This tradeoff of fidelity to the data versus simplicity will be important in the discussion of model selection in Section 2.3.1.
The only parameter left unaccounted for in the estimation scheme is the variance of the errors  . An unbiased estimate is provided by the residual mean square,
(1.8) 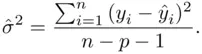
This estimate has a direct, but often underappreciated, use in assessing the practical importance of the model. Does knowing  really say anything of value about
  ? This isn't a question that can be answered completely statistically; it requires knowledge and understanding of the data and the underlying random process (that is, it requires context). Recall that the model assumes that the errors are normally distributed with standard deviation
  . This means that, roughly speaking,
  of the time an observed
  value falls within
  of the expected response
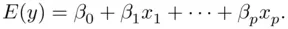
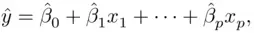
 can be estimated for any given set of
  values using
while the square root of the residual mean square (1.8), termed the standard error of the estimate, provides an estimate of  that can be used in constructing this rough prediction interval
  .
.
1.3.3 HYPOTHESIS TESTS AND CONFIDENCE INTERVALS FOR β
There are two types of hypothesis tests of immediate interest related to the regression coefficients.
1 Do any of the predictors provide predictive power for the target variable? This is a test of the overall significance of the regression,versusThe test of these hypotheses is the ‐test,This is referenced against a null ‐distribution on degrees of freedom.
2 Given the other variables in the model, does a particular predictor provide additional predictive power? This corresponds to a test of the significance of an individual coefficient,versusThis is tested using a ‐test,which is compared to a ‐distribution on degrees of freedom. Other values of can be specified in the null hypothesis (say ), with the ‐statistic becoming (1.9)The values of are obtained as the square roots of the diagonal elements of , where is the residual mean square (1.8). Note that for simple regression (), the hypotheses corresponding to the overall significance of the model and the significance of the predictor are identical,versusGiven the equivalence of the sets of hypotheses, it is not surprising that the associated tests are also equivalent; in fact, , and the associated tail probabilities of the two tests are identical.A ‐test for the intercept also can be constructed as in (1.9), although this does not refer to a hypothesis about a predictor, but rather about whether the expected target is equal to a specified value if all of the predictors equal zero. As was noted in Section 1.3.1, this is often not physically meaningful (and therefore of little interest), because the condition that all predictors equal zero cannot occur, or does not come close to occurring in the observed data.
Читать дальшеИнтервал:
Закладка:
Похожие книги на «Handbook of Regression Analysis With Applications in R»
Представляем Вашему вниманию похожие книги на «Handbook of Regression Analysis With Applications in R» списком для выбора. Мы отобрали схожую по названию и смыслу литературу в надежде предоставить читателям больше вариантов отыскать новые, интересные, ещё непрочитанные произведения.


Обсуждение, отзывы о книге «Handbook of Regression Analysis With Applications in R» и просто собственные мнения читателей. Оставьте ваши комментарии, напишите, что Вы думаете о произведении, его смысле или главных героях. Укажите что конкретно понравилось, а что нет, и почему Вы так считаете.