Samprit Chatterjee - Handbook of Regression Analysis With Applications in R
Здесь есть возможность читать онлайн «Samprit Chatterjee - Handbook of Regression Analysis With Applications in R» — ознакомительный отрывок электронной книги совершенно бесплатно, а после прочтения отрывка купить полную версию. В некоторых случаях можно слушать аудио, скачать через торрент в формате fb2 и присутствует краткое содержание. Жанр: unrecognised, на английском языке. Описание произведения, (предисловие) а так же отзывы посетителей доступны на портале библиотеки ЛибКат.

- Название:Handbook of Regression Analysis With Applications in R
- Автор:
- Жанр:
- Год:неизвестен
- ISBN:нет данных
- Рейтинг книги:3 / 5. Голосов: 1
-
Избранное:Добавить в избранное
- Отзывы:
-
Ваша оценка:
Handbook of Regression Analysis With Applications in R: краткое содержание, описание и аннотация
Предлагаем к чтению аннотацию, описание, краткое содержание или предисловие (зависит от того, что написал сам автор книги «Handbook of Regression Analysis With Applications in R»). Если вы не нашли необходимую информацию о книге — напишите в комментариях, мы постараемся отыскать её.
andbook and reference guide for students and practitioners of statistical regression-based analyses in R
Handbook of Regression Analysis
with Applications in R, Second Edition
The book further pays particular attention to methods that have become prominent in the last few decades as increasingly large data sets have made new techniques and applications possible. These include:
Regularization methods Smoothing methods Tree-based methods In the new edition of the
, the data analyst’s toolkit is explored and expanded. Examples are drawn from a wide variety of real-life applications and data sets. All the utilized R code and data are available via an author-maintained website.
Of interest to undergraduate and graduate students taking courses in statistics and regression, the
will also be invaluable to practicing data scientists and statisticians.
Handbook of Regression Analysis With Applications in R — читать онлайн ознакомительный отрывок
Ниже представлен текст книги, разбитый по страницам. Система сохранения места последней прочитанной страницы, позволяет с удобством читать онлайн бесплатно книгу «Handbook of Regression Analysis With Applications in R», без необходимости каждый раз заново искать на чём Вы остановились. Поставьте закладку, и сможете в любой момент перейти на страницу, на которой закончили чтение.
Интервал:
Закладка:
All of these tests, intervals, predictions, and so on, are based on the belief that the assumptions of the regression model hold. Thus, it is crucially important that these assumptions be checked. Remarkably enough, a few very simple plots can provide much of the evidence needed to check the assumptions.
1 A plot of the residuals versus the fitted values. This plot should have no pattern to it; that is, no structure should be apparent. Certain kinds of structure indicate potential problems:A point (or a few points) isolated at the top or bottom, or left or right. In addition, often the rest of the points have a noticeable “tilt” to them. These isolated points are unusual observations and can have a strong effect on the regression. They need to be examined carefully and possibly removed from the data set.An impression of different heights of the point cloud as the plot is examined from left to right. This indicates potential heteroscedasticity (nonconstant variance).
2 Plots of the residuals versus each of the predictors. Again, a plot with no apparent structure is desired.
3 If the data set has a time structure to it, residuals should be plotted in time order. Again, there should be no apparent pattern. If there is a cyclical structure, this indicates that the errors are not uncorrelated, as they are supposed to be (that is, there is potentially autocorrelation in the errors).
4 A normal plot of the residuals. This plot assesses the apparent normality of the residuals, by plotting the observed ordered residuals on one axis and the expected positions (under normality) of those ordered residuals on the other. The plot should look like a straight line (roughly). Isolated points once again represent unusual observations, while a curved line indicates that the errors are probably not normally distributed, and tests and intervals might not be trustworthy.
Note that all of these plots should be routinely examined in any regression analysis, although in order to save space not all will necessarily be presented in all of the analyses in the book.
An implicit assumption in any model that is being used for prediction is that the future “looks like” the past; that is, it is not sufficient that these assumptions appear to hold for the available data, as they also must continue to hold for new data on which the estimated model is applied. Indeed, the assumption is stronger than that, since it must be the case that the future is exactly the same as the past, in the sense that all of the properties of the model, including the precise values of all of the regression parameters, are the same. This is unlikely to be exactly true, so a more realistic point of view is that the future should be similar enough to the past so that predictions based on the past are useful. A related point is that predictions should not be based on extrapolation, where the predictor values are far from the values used to build the model. Similarly, if the observations form a time series, predictions far into the future are unlikely to be very useful.
In general, the more complex a model is, the less likely it is that all of its characteristics will remain stable going forward, which implies that a reasonable goal is to try to find a model that is as simple as it can be while still accounting for the important effects in the data. This leads to questions of model building, which is the subject of Chapter 2.
1.4 Example — Estimating Home Prices
Determining the appropriate sale price for a home is clearly of great interest to both buyers and sellers. While this can be done in principle by examining the prices at which other similar homes have recently sold, the well‐known existence of strong effects related to location means that there are likely to be relatively few homes with the same important characteristics to make the comparison. A solution to this problem is the use of hedonic regression models, where the sale prices of a set of homes in a particular area are regressed on important characteristics of the home such as the number of bedrooms, the living area, the lot size, and so on. Academic research on this topic is plentiful, going back to at least Wabe (1971).
This analysis is based on a sample from public data on sales of one‐family homes in the Levittown, NY area from June 2010 through May 2011. Levittown is famous as the first planned suburban community built using mass production methods, being aimed at former members of the military after World War II. Most of the homes in this community were built in the late 1940s to early 1950s, without basements and designed to make expansion on the second floor relatively easy.
For each of the  houses in the sample, the number of bedrooms, number of bathrooms, living area (in square feet), lot size (in square feet), the year the house was built, and the property taxes are used as potential predictors of the sale price. In any analysis the first step is to look at the data, and Figure 1.4gives scatter plots of sale price versus each predictor. It is apparent that there is a positive association between sale price and each variable, other than number of bedrooms and lot size. We also note that there are two houses with unusually large living areas for this sample, two with unusually large property taxes (these are not the same two houses), and three that were built six or seven years later than all of the other houses in the sample.
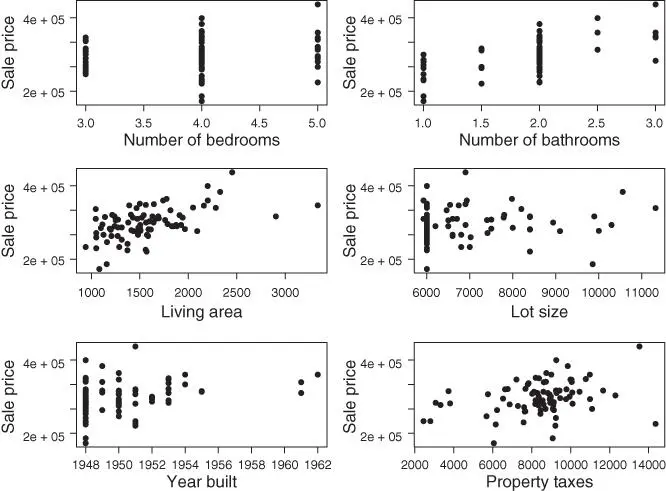
FIGURE 1.4: Scatter plots of sale price versus each predictor for the home price data.
The output below summarizes the results of a multiple regression fit.
Coefficients: Estimate Std. Error t value Pr(>|t|) (Intercept) -7.149e+06 3.820e+06 -1.871 0.065043 . Bedrooms -1.229e+04 9.347e+03 -1.315 0.192361 Bathrooms 5.170e+04 1.309e+04 3.948 0.000171 *** Living.area 6.590e+01 1.598e+01 4.124 9.22e-05 *** Lot.size -8.971e-01 4.194e+00 -0.214 0.831197 Year.built 3.761e+03 1.963e+03 1.916 0.058981 . Property.tax 1.476e+00 2.832e+00 0.521 0.603734 --- Signif. codes: 0 ‘***’ 0.001 ‘**’ 0.01 ‘*’ 0.05 ‘.’ 0.1 ‘ ’ 1 Residual standard error: 47380 on 78 degrees of freedom Multiple R-squared: 0.5065, Adjusted R-squared: 0.4685 F-statistic: 13.34 on 6 and 78 DF, p-value: 2.416e-10
The overall regression is strongly statistically significant, with the tail probability of the  ‐test roughly
  . The predictors account for roughly
  of the variability in sale prices (
  ). Two of the predictors (number of bathrooms and living area) are highly statistically significant, with tail probabilities less than
  , and the coefficient of the year built variable is marginally statistically significant. The coefficients imply that given all else in the model is held fixed, one additional bathroom in a house is associated with an estimated expected price that is
  higher; one additional square foot of living area is associated with an estimated expected price that is
  higher (given the typical value of the living area variable, a more meaningful statement would probably be that an additional
  square feet of living area is associated with an estimated expected price that is
  higher); and a house being built one year later is associated with an estimated expected price that is
  higher.
Интервал:
Закладка:
Похожие книги на «Handbook of Regression Analysis With Applications in R»
Представляем Вашему вниманию похожие книги на «Handbook of Regression Analysis With Applications in R» списком для выбора. Мы отобрали схожую по названию и смыслу литературу в надежде предоставить читателям больше вариантов отыскать новые, интересные, ещё непрочитанные произведения.


Обсуждение, отзывы о книге «Handbook of Regression Analysis With Applications in R» и просто собственные мнения читателей. Оставьте ваши комментарии, напишите, что Вы думаете о произведении, его смысле или главных героях. Укажите что конкретно понравилось, а что нет, и почему Вы так считаете.