Samprit Chatterjee - Handbook of Regression Analysis With Applications in R
Здесь есть возможность читать онлайн «Samprit Chatterjee - Handbook of Regression Analysis With Applications in R» — ознакомительный отрывок электронной книги совершенно бесплатно, а после прочтения отрывка купить полную версию. В некоторых случаях можно слушать аудио, скачать через торрент в формате fb2 и присутствует краткое содержание. Жанр: unrecognised, на английском языке. Описание произведения, (предисловие) а так же отзывы посетителей доступны на портале библиотеки ЛибКат.

- Название:Handbook of Regression Analysis With Applications in R
- Автор:
- Жанр:
- Год:неизвестен
- ISBN:нет данных
- Рейтинг книги:3 / 5. Голосов: 1
-
Избранное:Добавить в избранное
- Отзывы:
-
Ваша оценка:
Handbook of Regression Analysis With Applications in R: краткое содержание, описание и аннотация
Предлагаем к чтению аннотацию, описание, краткое содержание или предисловие (зависит от того, что написал сам автор книги «Handbook of Regression Analysis With Applications in R»). Если вы не нашли необходимую информацию о книге — напишите в комментариях, мы постараемся отыскать её.
andbook and reference guide for students and practitioners of statistical regression-based analyses in R
Handbook of Regression Analysis
with Applications in R, Second Edition
The book further pays particular attention to methods that have become prominent in the last few decades as increasingly large data sets have made new techniques and applications possible. These include:
Regularization methods Smoothing methods Tree-based methods In the new edition of the
, the data analyst’s toolkit is explored and expanded. Examples are drawn from a wide variety of real-life applications and data sets. All the utilized R code and data are available via an author-maintained website.
Of interest to undergraduate and graduate students taking courses in statistics and regression, the
will also be invaluable to practicing data scientists and statisticians.
Handbook of Regression Analysis With Applications in R — читать онлайн ознакомительный отрывок
Ниже представлен текст книги, разбитый по страницам. Система сохранения места последней прочитанной страницы, позволяет с удобством читать онлайн бесплатно книгу «Handbook of Regression Analysis With Applications in R», без необходимости каждый раз заново искать на чём Вы остановились. Поставьте закладку, и сможете в любой момент перейти на страницу, на которой закончили чтение.
Интервал:
Закладка:
The  ‐tests and
  ‐test of Section 1.3.3are special cases of a general formulation that is useful for comparing certain classes of models. It might be the case that a simpler version of a candidate model (a subset model) might be adequate to fit the data. For example, consider taking a sample of college students and determining their college grade point average (
  ), Scholastic Aptitude Test (SAT) evidence‐based reading and writing score (
  ), and SAT math score (
  ). The full regression model to fit to these data is

Instead of considering reading and math scores separately, we could consider whether  can be predicted by one variable: total SAT score, which is the sum of
  and
and  . This subset model is

with  . This equality condition is called a linear restriction, because it defines a linear condition on the parameters of the regression model (that is, it only involves additions, subtractions, and equalities of coefficients and constants).
The question about whether the total SAT score is sufficient to predict grade point average can be stated using a hypothesis test about this linear restriction. As always, the null hypothesis gets the benefit of the doubt; in this case, that is the simpler restricted (subset) model that the sum of  and
and  is adequate, since it says that only one predictor is needed, rather than two. The alternative hypothesis is the unrestricted full model (with no conditions on
  ). That is,
versus
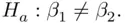
These hypotheses are tested using a partial  ‐test. The
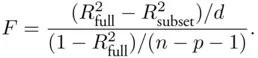
  ‐statistic has the form
(2.1) 
where  is the sample size,
  is the number of predictors in the full model, and
  is the difference between the number of parameters in the full model and the number of parameters in the subset model. This statistic is compared to an
  distribution on
  degrees of freedom. So, for example, for this GPA/SAT example,
  and
and  , so the observed
  ‐statistic would be compared to an
  distribution on
  degrees of freedom. Some statistical packages allow specification of the full and subset models and will calculate the
  ‐test, but others do not, and the statistic has to be calculated manually based on the fits of the two models.
An alternative form for the  ‐test above might make clearer what is going on here:
That is, if the strength of the fit of the full model (measured by  ) isn't much larger than that of the subset model, the
  ‐statistic is small, and we do not reject the subset model; if, on the other hand, the difference in
  values is large (implying that the fit of the full model is noticeably stronger), we do reject the subset model in favor of the full model.
Интервал:
Закладка:
Похожие книги на «Handbook of Regression Analysis With Applications in R»
Представляем Вашему вниманию похожие книги на «Handbook of Regression Analysis With Applications in R» списком для выбора. Мы отобрали схожую по названию и смыслу литературу в надежде предоставить читателям больше вариантов отыскать новые, интересные, ещё непрочитанные произведения.


Обсуждение, отзывы о книге «Handbook of Regression Analysis With Applications in R» и просто собственные мнения читателей. Оставьте ваши комментарии, напишите, что Вы думаете о произведении, его смысле или главных героях. Укажите что конкретно понравилось, а что нет, и почему Вы так считаете.