Samprit Chatterjee - Handbook of Regression Analysis With Applications in R
Здесь есть возможность читать онлайн «Samprit Chatterjee - Handbook of Regression Analysis With Applications in R» — ознакомительный отрывок электронной книги совершенно бесплатно, а после прочтения отрывка купить полную версию. В некоторых случаях можно слушать аудио, скачать через торрент в формате fb2 и присутствует краткое содержание. Жанр: unrecognised, на английском языке. Описание произведения, (предисловие) а так же отзывы посетителей доступны на портале библиотеки ЛибКат.

- Название:Handbook of Regression Analysis With Applications in R
- Автор:
- Жанр:
- Год:неизвестен
- ISBN:нет данных
- Рейтинг книги:3 / 5. Голосов: 1
-
Избранное:Добавить в избранное
- Отзывы:
-
Ваша оценка:
Handbook of Regression Analysis With Applications in R: краткое содержание, описание и аннотация
Предлагаем к чтению аннотацию, описание, краткое содержание или предисловие (зависит от того, что написал сам автор книги «Handbook of Regression Analysis With Applications in R»). Если вы не нашли необходимую информацию о книге — напишите в комментариях, мы постараемся отыскать её.
andbook and reference guide for students and practitioners of statistical regression-based analyses in R
Handbook of Regression Analysis
with Applications in R, Second Edition
The book further pays particular attention to methods that have become prominent in the last few decades as increasingly large data sets have made new techniques and applications possible. These include:
Regularization methods Smoothing methods Tree-based methods In the new edition of the
, the data analyst’s toolkit is explored and expanded. Examples are drawn from a wide variety of real-life applications and data sets. All the utilized R code and data are available via an author-maintained website.
Of interest to undergraduate and graduate students taking courses in statistics and regression, the
will also be invaluable to practicing data scientists and statisticians.
Handbook of Regression Analysis With Applications in R — читать онлайн ознакомительный отрывок
Ниже представлен текст книги, разбитый по страницам. Система сохранения места последней прочитанной страницы, позволяет с удобством читать онлайн бесплатно книгу «Handbook of Regression Analysis With Applications in R», без необходимости каждый раз заново искать на чём Вы остановились. Поставьте закладку, и сможете в любой момент перейти на страницу, на которой закончили чтение.
Интервал:
Закладка:
A diagnostic to determine this in general is the variance inflation factor(  ) for each predicting variable, which is defined as
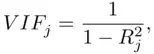
where  is the
  of the regression of the variable
  on the other predicting variables.
  gives the proportional increase in the variance of
  compared to what it would have been if the predicting variables had been uncorrelated. There are no formal cutoffs as to what constitutes a large
  , but collinearity is generally not a problem if the observed
  satisfies
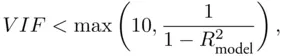
where  is the usual
  for the regression fit. This means that either the predictors are more related to the target variable than they are to each other, or they are not related to each other very much. In either case coefficient estimates are not very likely to be very unstable, so collinearity is not a problem. If collinearity is present, a simplified model should be considered, but this is only a general guideline; sometimes two (or more) collinear predictors might be needed in order to adequately model the target variable. In the next section we discuss a methodology for judging the adequacy of fitted models and comparing them.
2.3 Methodology
2.3.1 MODEL SELECTION
We saw in Section 2.2.1that hypothesis tests can be used to compare models. Unfortunately, there are several reasons why such tests are not adequate for the task of choosing among a set of candidate models for the appropriate model to use.
In addition to the effects of correlated predictors on  ‐tests noted earlier, partial
  ‐tests only can compare models that are nested (that is, where one is a special case of the other). Comparing a model based on
  to one based on
  , for example, is clearly important, but is impossible using these testing methods.
Even ignoring these issues, hypothesis tests don't necessarily address the question a data analyst is most interested in. With a large enough sample, almost any estimated slope will be significantly different from zero, but that doesn't mean that the predictor provides additional useful predictive power. Similarly, in small samples, important effects might not be statistically significant at typical levels simply because of insufficient data. That is, there is a clear distinction between statistical significance and practical importance.
In this section we discuss a strategy for determining a “best” model (or more correctly, a set of “best” models) among a larger class of candidate models, using objective measures designed to reflect a predictive point of view. As a first step, it is good to explicitly identify what should not be done. In recent years, it has become commonplace for databases to be constructed with hundreds (or thousands) of variables and hundreds of thousands (or millions) of observations. It is tempting to avoid issues related to choosing the potential set of candidate models by considering all of the variables as potential predictors in a regression model, limited only by available computing power. This would be a mistake. If too large a set of possible predictors is considered, it is very likely that variables will be identified as important just due to random chance. Since they do not reflect real relationships in the population, models based on them will predict poorly in the future, and interpretations of slope coefficients will just be mistaken explanations of what is actually random behavior. This sort of overfitting is known as “data dredging” and is among the most serious dangers when analyzing data.
The set of possible models should ideally be chosen before seeing any data based on as thorough an understanding of the underlying random process as possible. Potential predictors should be justifiable on theoretical grounds if at all possible. This is by necessity at least somewhat subjective, but good basic principles exist. Potential models to consider should be based on the scientific literature and previous relevant experiments. In particular, if a model simply doesn't “make sense,” it shouldn't be considered among the possible candidates. That does not mean that modifications and extensions of models that are suggested by the analysis should be ignored (indeed, this is the subject of the next three chapters), but an attempt to keep models grounded in what is already understood about the underlying process is always a good idea.
What do we mean by the (or a) “best” model? As was stated on page 4, there is no “true” model, since any model is only a representation of reality (or equivalently, the true model is too complex to be modeled usefully). Since the goal is not to find the “true” model, but rather to find a model or set of models that best balances fit and simplicity, any strategy used to guide model selection should be consistent with this principle. The goal is to provide a good predictive model that also provides useful descriptions of the process being studied from estimated parameters.
Once a potential set of predictors is chosen, most statistical packages include the capability to produce summary statistics for all possible regression models using those predictors. Such algorithms (often called best subsetsalgorithms) do not actually look at all possible models, but rather list statistics for only the models with strongest fits for each number of predictors in the model. Such a listing can then be used to determine a set of potential “best” models to consider more closely. The most common algorithm, described in Furnival and Wilson (1974), is based on branch and bound optimization, and while it is much less computationally intensive than examining all possible models, it still has a practical feasible limit of roughly  to
to  predictors. In Chapter 14, we discuss model selection and fitting for (potentially much) larger numbers of predictors.
Интервал:
Закладка:
Похожие книги на «Handbook of Regression Analysis With Applications in R»
Представляем Вашему вниманию похожие книги на «Handbook of Regression Analysis With Applications in R» списком для выбора. Мы отобрали схожую по названию и смыслу литературу в надежде предоставить читателям больше вариантов отыскать новые, интересные, ещё непрочитанные произведения.


Обсуждение, отзывы о книге «Handbook of Regression Analysis With Applications in R» и просто собственные мнения читателей. Оставьте ваши комментарии, напишите, что Вы думаете о произведении, его смысле или главных героях. Укажите что конкретно понравилось, а что нет, и почему Вы так считаете.