Samprit Chatterjee - Handbook of Regression Analysis With Applications in R
Здесь есть возможность читать онлайн «Samprit Chatterjee - Handbook of Regression Analysis With Applications in R» — ознакомительный отрывок электронной книги совершенно бесплатно, а после прочтения отрывка купить полную версию. В некоторых случаях можно слушать аудио, скачать через торрент в формате fb2 и присутствует краткое содержание. Жанр: unrecognised, на английском языке. Описание произведения, (предисловие) а так же отзывы посетителей доступны на портале библиотеки ЛибКат.

- Название:Handbook of Regression Analysis With Applications in R
- Автор:
- Жанр:
- Год:неизвестен
- ISBN:нет данных
- Рейтинг книги:3 / 5. Голосов: 1
-
Избранное:Добавить в избранное
- Отзывы:
-
Ваша оценка:
Handbook of Regression Analysis With Applications in R: краткое содержание, описание и аннотация
Предлагаем к чтению аннотацию, описание, краткое содержание или предисловие (зависит от того, что написал сам автор книги «Handbook of Regression Analysis With Applications in R»). Если вы не нашли необходимую информацию о книге — напишите в комментариях, мы постараемся отыскать её.
andbook and reference guide for students and practitioners of statistical regression-based analyses in R
Handbook of Regression Analysis
with Applications in R, Second Edition
The book further pays particular attention to methods that have become prominent in the last few decades as increasingly large data sets have made new techniques and applications possible. These include:
Regularization methods Smoothing methods Tree-based methods In the new edition of the
, the data analyst’s toolkit is explored and expanded. Examples are drawn from a wide variety of real-life applications and data sets. All the utilized R code and data are available via an author-maintained website.
Of interest to undergraduate and graduate students taking courses in statistics and regression, the
will also be invaluable to practicing data scientists and statisticians.
Handbook of Regression Analysis With Applications in R — читать онлайн ознакомительный отрывок
Ниже представлен текст книги, разбитый по страницам. Система сохранения места последней прочитанной страницы, позволяет с удобством читать онлайн бесплатно книгу «Handbook of Regression Analysis With Applications in R», без необходимости каждый раз заново искать на чём Вы остановились. Поставьте закладку, и сможете в любой момент перейти на страницу, на которой закончили чтение.
Интервал:
Закладка:
4 The errors are normally distributed. This is needed if we want to construct any confidence or prediction intervals, or hypothesis tests, which we usually do. If this assumption is violated, hypothesis tests and confidence and prediction intervals can be very misleading.
Since violation of these assumptions can potentially lead to completely misleading results, a fundamental part of any regression analysis is to check them using various plots, tests, and diagnostics.
1.3 Methodology
1.3.1 INTERPRETING REGRESSION COEFFICIENTS
The least squares regression coefficients have very specific meanings. They are often misinterpreted, so it is important to be clear on what they mean (and do not mean). Consider first the intercept,  .
.
1 : The estimated expected value of the target variable when the predictors are all equal to zero.
Note that this might not have any physical interpretation, since a zero value for the predictor(s) might be impossible, or might never come close to occurring in the observed data. In that situation, it is pointless to try to interpret this value. If all of the predictors are centered to have zero mean, then  necessarily equals
  , the sample mean of the target values. Note that if there is any particular value for each predictor that is meaningful in some sense, if each variable is centered around its particular value, then the intercept is an estimate of
  when the predictors all have those meaningful values.
The estimated coefficient for the  th predictor (
  ) is interpreted in the following way:
1 : The estimated expected change in the target variable associated with a one unit change in the th predicting variable, holding all else in the model fixed.
There are several noteworthy aspects to this interpretation. First, note the word associated — we cannot say that a change in the target variable is caused by a change in the predictor, only that they are associated with each other. That is, correlation does not imply causation.
Another key point is the phrase “holding all else in the model fixed,” the implications of which are often ignored. Consider the following hypothetical example. A random sample of college students at a particular university is taken in order to understand the relationship between college grade point average (GPA) and other variables. A model is built with college GPA as a function of high school GPA and the standardized Scholastic Aptitude Test (SAT), with resultant least squares fit

It is tempting to say (and many people would say) that the coefficient for SAT score has the “wrong sign,” because it says that higher values of SAT are associated with lower values of college GPA. This is not correct. The problem is that it is likely in this context that what an analyst would find intuitive is the marginal relationship between college GPA and SAT score alone (ignoring all else), one that we would indeed expect to be a direct (positive) one. The regression coefficient does not say anything about that marginal relationship. Rather, it refers to the conditional (sometimes called partial) relationship that takes the high school GPA as fixed, which is apparently that higher values of SAT are associated with lower values of college GPA, holding high school GPA fixed. High school GPA and SAT are no doubt related to each other, and it is quite likely that this relationship between the predictors would complicate any understanding of, or intuition about, the conditional relationship between college GPA and SAT score. Multiple regression coefficients should not be interpreted marginally; if you really are interested in the relationship between the target and a single predictor alone, you should simply do a regression of the target on only that variable. This does not mean that multiple regression coefficients are uninterpretable, only that care is necessary when interpreting them.
Another common use of multiple regression that depends on this conditional interpretation of the coefficients is to explicitly include “control” variables in a model in order to try to account for their effect statistically. This is particularly important in observational data (data that are not the result of a designed experiment), since in that case, the effects of other variables cannot be ignored as a result of random assignment in the experiment. For observational data it is not possible to physically intervene in the experiment to “hold other variables fixed,” but the multiple regression framework effectively allows this to be done statistically.
Having said this, we must recognize that in many situations, it is impossible from a practical point of view to change one predictor while holding all else fixed. Thus, while we would like to interpret a coefficient as accounting for the presence of other predictors in a physical sense, it is important (when dealing with observational data in particular) to remember that linear regression is at best only an approximation to the actual underlying random process.
1.3.2 MEASURING THE STRENGTH OF THE REGRESSION RELATIONSHIP
The least squares estimates possess an important property:
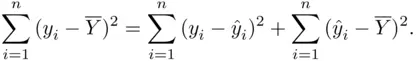
This formula says that the variability in the target variable (the left side of the equation, termed the corrected total sum of squares) can be split into two mutually exclusive parts — the variability left over after doing the regression (the first term on the right side, the residual sum of squares), and the variability accounted for by doing the regression (the second term, the regression sum of squares). This immediately suggests the usefulness of  as a measure of the strength of the regression relationship, where

The  value (also called the coefficient of determination) estimates the population proportion of variability in
  accounted for by the best linear combination of the predictors. Values closer to
  indicate a good deal of predictive power of the predictors for the target variable, while values closer to
  indicate little predictive power. An equivalent representation of
  is
is
Интервал:
Закладка:
Похожие книги на «Handbook of Regression Analysis With Applications in R»
Представляем Вашему вниманию похожие книги на «Handbook of Regression Analysis With Applications in R» списком для выбора. Мы отобрали схожую по названию и смыслу литературу в надежде предоставить читателям больше вариантов отыскать новые, интересные, ещё непрочитанные произведения.


Обсуждение, отзывы о книге «Handbook of Regression Analysis With Applications in R» и просто собственные мнения читателей. Оставьте ваши комментарии, напишите, что Вы думаете о произведении, его смысле или главных героях. Укажите что конкретно понравилось, а что нет, и почему Вы так считаете.