Samprit Chatterjee - Handbook of Regression Analysis With Applications in R
Здесь есть возможность читать онлайн «Samprit Chatterjee - Handbook of Regression Analysis With Applications in R» — ознакомительный отрывок электронной книги совершенно бесплатно, а после прочтения отрывка купить полную версию. В некоторых случаях можно слушать аудио, скачать через торрент в формате fb2 и присутствует краткое содержание. Жанр: unrecognised, на английском языке. Описание произведения, (предисловие) а так же отзывы посетителей доступны на портале библиотеки ЛибКат.

- Название:Handbook of Regression Analysis With Applications in R
- Автор:
- Жанр:
- Год:неизвестен
- ISBN:нет данных
- Рейтинг книги:3 / 5. Голосов: 1
-
Избранное:Добавить в избранное
- Отзывы:
-
Ваша оценка:
Handbook of Regression Analysis With Applications in R: краткое содержание, описание и аннотация
Предлагаем к чтению аннотацию, описание, краткое содержание или предисловие (зависит от того, что написал сам автор книги «Handbook of Regression Analysis With Applications in R»). Если вы не нашли необходимую информацию о книге — напишите в комментариях, мы постараемся отыскать её.
andbook and reference guide for students and practitioners of statistical regression-based analyses in R
Handbook of Regression Analysis
with Applications in R, Second Edition
The book further pays particular attention to methods that have become prominent in the last few decades as increasingly large data sets have made new techniques and applications possible. These include:
Regularization methods Smoothing methods Tree-based methods In the new edition of the
, the data analyst’s toolkit is explored and expanded. Examples are drawn from a wide variety of real-life applications and data sets. All the utilized R code and data are available via an author-maintained website.
Of interest to undergraduate and graduate students taking courses in statistics and regression, the
will also be invaluable to practicing data scientists and statisticians.
Handbook of Regression Analysis With Applications in R — читать онлайн ознакомительный отрывок
Ниже представлен текст книги, разбитый по страницам. Система сохранения места последней прочитанной страницы, позволяет с удобством читать онлайн бесплатно книгу «Handbook of Regression Analysis With Applications in R», без необходимости каждый раз заново искать на чём Вы остановились. Поставьте закладку, и сможете в любой момент перейти на страницу, на которой закончили чтение.
Интервал:
Закладка:
1 1.1 Introduction
2 1.2 Concepts and Background Material 1.2.1The Linear Regression Model 1.2.2Estimation Using Least Squares 1.2.3Assumptions
3 1.3 Methodology 1.3.1Interpreting Regression Coefficients 1.3.2Measuring the Strength of the Regression Relationship 1.3.3Hypothesis Tests and Confidence Intervals for β 1.3.4Fitted Values and Predictions 1.3.5Checking Assumptions Using Residual Plots
4 1.4 Example—Estimating Home Prices
5 1.5 Summary
1.1 Introduction
This is a book about regression modeling, but when we refer to regression models, what do we mean? The regression framework can be characterized in the following way:
1 We have one particular variable that we are interested in understanding or modeling, such as sales of a particular product, sale price of a home, or voting preference of a particular voter. This variable is called the target, response, or dependent variable, and is usually represented by .
2 We have a set of other variables that we think might be useful in predicting or modeling the target variable (the price of the product, the competitor's price, and so on; or the lot size, number of bedrooms, number of bathrooms of the home, and so on; or the gender, age, income, party membership of the voter, and so on). These are called the predicting, or independent variables, and are usually represented by , , etc.
Typically, a regression analysis is used for one (or more) of three purposes:
1 modeling the relationship between and ;
2 prediction of the target variable (forecasting);
3 and testing of hypotheses.
In this chapter, we introduce the basic multiple linear regression model, and discuss how this model can be used for these three purposes. Specifically, we discuss the interpretations of the estimates of different regression parameters, the assumptions underlying the model, measures of the strength of the relationship between the target and predictor variables, the construction of tests of hypotheses and intervals related to regression parameters, and the checking of assumptions using diagnostic plots.
1.2 Concepts and Background Material
1.2.1 THE LINEAR REGRESSION MODEL
The data consist of  observations, which are sets of observed values
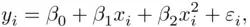
 that represent a random sample from a larger population. It is assumed that these observations satisfy a linear relationship,
(1.1) 
where the  coefficients are unknown parameters, and the
  are random error terms. By a linear model, it is meant that the model is linear in the parameters ; a quadratic model,
paradoxically enough, is a linear model, since  and
and  are just versions of
  and
and  .
.
It is important to recognize that this, or any statistical model, is not viewed as a true representation of reality; rather, the goal is that the model be a useful representation of reality. A model can be used to explore the relationships between variables and make accurate forecasts based on those relationships even if it is not the “truth.” Further, any statistical model is only temporary, representing a provisional version of views about the random process being studied. Models can, and should, change, based on analysis using the current model, selection among several candidate models, the acquisition of new data, new understanding of the underlying random process, and so on. Further, it is often the case that there are several different models that are reasonable representations of reality. Having said this, we will sometimes refer to the “true” model, but this should be understood as referring to the underlying form of the currently hypothesized representation of the regression relationship.
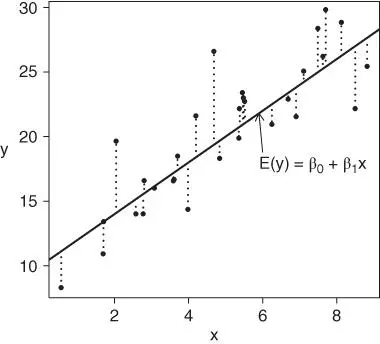
FIGURE 1.1: The simple linear regression model. The solid line corresponds to the true regression line, and the dotted lines correspond to the random errors  .
.
The special case of (1.1)with  corresponds to the simple regression model, and is consistent with the representation in Figure 1.1. The solid line is the true regression line, the expected value of
  given the value of
  . The dotted lines are the random errors
  that account for the lack of a perfect association between the predictor and the target variables.
1.2.2 ESTIMATION USING LEAST SQUARES
The true regression function represents the expected relationship between the target and the predictor variables, which is unknown. A primary goal of a regression analysis is to estimate this relationship, or equivalently, to estimate the unknown parameters  . This requires a data‐based rule, or criterion, that will give a reasonable estimate. The standard approach is least squares regression, where the estimates are chosen to minimize
(1.2) 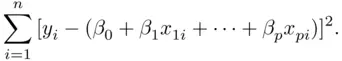
Интервал:
Закладка:
Похожие книги на «Handbook of Regression Analysis With Applications in R»
Представляем Вашему вниманию похожие книги на «Handbook of Regression Analysis With Applications in R» списком для выбора. Мы отобрали схожую по названию и смыслу литературу в надежде предоставить читателям больше вариантов отыскать новые, интересные, ещё непрочитанные произведения.


Обсуждение, отзывы о книге «Handbook of Regression Analysis With Applications in R» и просто собственные мнения читателей. Оставьте ваши комментарии, напишите, что Вы думаете о произведении, его смысле или главных героях. Укажите что конкретно понравилось, а что нет, и почему Вы так считаете.