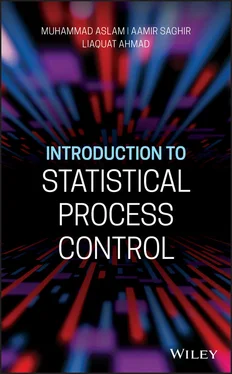
Muhammad Aslam - Introduction to Statistical Process Control

Здесь есть возможность читать онлайн «Muhammad Aslam - Introduction to Statistical Process Control» — ознакомительный отрывок электронной книги совершенно бесплатно, а после прочтения отрывка купить полную версию. В некоторых случаях можно слушать аудио, скачать через торрент в формате fb2 и присутствует краткое содержание. Жанр: unrecognised, на английском языке. Описание произведения, (предисловие) а так же отзывы посетителей доступны на портале библиотеки ЛибКат.

Introduction to Statistical Process Control: краткое содержание, описание и аннотация

Предлагаем к чтению аннотацию, описание, краткое содержание или предисловие (зависит от того, что написал сам автор книги «Introduction to Statistical Process Control»). Если вы не нашли необходимую информацию о книге — напишите в комментариях, мы постараемся отыскать её.

An Introduction to the Fundamentals and History of Control Charts, Applications, and Guidelines for Implementation Introduction to Statistical Process Control This eight-chapter reference breaks information down into digestible sections and covers topics including:
● An introduction to the basics as well as a background of control charts
● Widely used and newly researched attributes of control charts, including guidelines for implementation
● The process capability index for both normal and non-normal distribution via the sampling of multiple dependent states
● An overview of attribute control charts based on memory statistics
● The development of control charts using EQMA statistics 
For a solid understanding of control methodologies and the basics of quality assurance,
is a definitive reference designed to be read by practitioners and students alike. It is an essential textbook for those who want to explore quality control and systems design.
Introduction to Statistical Process Control — читать онлайн ознакомительный отрывок

Ниже представлен текст книги, разбитый по страницам. Система сохранения места последней прочитанной страницы, позволяет с удобством читать онлайн бесплатно книгу «Introduction to Statistical Process Control», без необходимости каждый раз заново искать на чём Вы остановились. Поставьте закладку, и сможете в любой момент перейти на страницу, на которой закончили чтение.

Тёмная тема
Сбросить

Интервал:

Закладка:

Сделать
Introduction to Statistical Process Control - изображение 29

where l is the lower class boundary of the median class and c is the cumulative frequency.

The family of median consists of partitioning of observations into different parts. As median is defined as the value that divides the data into 2 equal parts, the observations may be divided into 4, 10, or 100 equal parts. These measures are known as the quantiles. When data are divided into four parts, then it is called quartiles. Upper and lower quartiles or Q 1and Q 3may be defined as

and The decile is defined as the value that divides the data into 10 equal - фото 30

and

The decile is defined as the value that divides the data into 10 equal parts - фото 31

The decile is defined as the value that divides the data into 10 equal parts.

The other values of deciles can be calculated accordingly as the subscript is - фото 32

The other values of deciles can be calculated accordingly as the subscript is multiplied with the numerator. For example, the sixth decile may be calculated as

The percentiles may be defined as the value that divides the data into 100 - фото 33

The percentiles may be defined as the value that divides the data into 100 equal parts:

The other values of percentiles can be calculated accordingly as the subscript - фото 34

The other values of percentiles can be calculated accordingly as the subscript is multiplied with the numerator. For example, the 70th percentile may be calculated as

The formula for the grouped data can be constructed accordingly iii The - фото 35

The formula for the grouped data can be constructed accordingly.

iii) The Mode

The mode is defined as the most repeated value in any data set. It is denoted by картинка 36. If there is no repetition in the data, then there will be no value of this measure. This is the single measurement whose results may be no value of mode, one value of mode, two values of the mode, or more values of mode in any data set.

The mode for the grouped data may be calculated as

Introduction to Statistical Process Control - изображение 37

iv) The Range

The range is defined as the difference between the maximum value and the minimum value of the data set:

Introduction to Statistical Process Control - изображение 38

or

Introduction to Statistical Process Control - изображение 39

The range for the grouped data may be calculated as

v The Quartile Deviation The quartile deviation is defined as the half of the - фото 40

v) The Quartile Deviation

The quartile deviation is defined as the half of the difference between the third and the first quartiles of the data set. The formula for the quartile deviation is defined as

Introduction to Statistical Process Control - изображение 41

It is to be noted that all the measures of dispersion are positive.

The coefficient of QD can be calculated as

vi The Mean Deviation The mean deviation is defined as the average of the - фото 42

vi) The Mean Deviation

The mean deviation is defined as the average of the deviations from the mean or median; the deviations are taken without algebraic sign. So the average deviation calculated from mean is known as the mean deviation from mean and is defined as

And the mean deviation from median and is defined as And for the grouped data - фото 43

And the mean deviation from median and is defined as

And for the grouped data these measures can be defined as And the mean - фото 44

And for the grouped data these measures can be defined as

And the mean deviation from median and is defined as The coefficient of MD is - фото 45

And the mean deviation from median and is defined as

The coefficient of MD is defined as It is to be noted tha - фото 46

The coefficient of MD is defined as

It is to be noted that coefficient of median deviation is smaller than the - фото 47 It is to be noted that coefficient of median deviation is smaller than the - фото 48

It is to be noted that coefficient of median deviation is smaller than the coefficient of mean deviation.

vii) The Variance

The variance is defined as the average of the squared deviation from mean. It is denoted by S 2. The formula for the variance may be defined as

Introduction to Statistical Process Control - изображение 49

The variance for the grouped data may be defined as

viii The Standard Deviation The standard deviation may be defined as the - фото 50

viii) The Standard Deviation

The standard deviation may be defined as the positive square root of the variance. It is denoted by S . The formula for the standard deviation may be defined as

The standard deviation for the grouped data may be defined as The coefficient - фото 51

The standard deviation for the grouped data may be defined as

The coefficient of variation may be defined as 142 Probability - фото 52

The coefficient of variation may be defined as

142 Probability Distributions The science of statistics is based on a number - фото 53

1.4.2 Probability Distributions

Читать дальше
Тёмная тема
Сбросить

Интервал:

Закладка:

Сделать

Похожие книги на «Introduction to Statistical Process Control»

Представляем Вашему вниманию похожие книги на «Introduction to Statistical Process Control» списком для выбора. Мы отобрали схожую по названию и смыслу литературу в надежде предоставить читателям больше вариантов отыскать новые, интересные, ещё непрочитанные произведения.


Отзывы о книге «Introduction to Statistical Process Control»

Обсуждение, отзывы о книге «Introduction to Statistical Process Control» и просто собственные мнения читателей. Оставьте ваши комментарии, напишите, что Вы думаете о произведении, его смысле или главных героях. Укажите что конкретно понравилось, а что нет, и почему Вы так считаете.

x