Muhammad Aslam - Introduction to Statistical Process Control
Здесь есть возможность читать онлайн «Muhammad Aslam - Introduction to Statistical Process Control» — ознакомительный отрывок электронной книги совершенно бесплатно, а после прочтения отрывка купить полную версию. В некоторых случаях можно слушать аудио, скачать через торрент в формате fb2 и присутствует краткое содержание. Жанр: unrecognised, на английском языке. Описание произведения, (предисловие) а так же отзывы посетителей доступны на портале библиотеки ЛибКат.
- Название:Introduction to Statistical Process Control
- Автор:
- Жанр:
- Год:неизвестен
- ISBN:нет данных
- Рейтинг книги:4 / 5. Голосов: 1
-
Избранное:Добавить в избранное
- Отзывы:
-
Ваша оценка:
Introduction to Statistical Process Control: краткое содержание, описание и аннотация
Предлагаем к чтению аннотацию, описание, краткое содержание или предисловие (зависит от того, что написал сам автор книги «Introduction to Statistical Process Control»). Если вы не нашли необходимую информацию о книге — напишите в комментариях, мы постараемся отыскать её.
● An introduction to the basics as well as a background of control charts
● Widely used and newly researched attributes of control charts, including guidelines for implementation
● The process capability index for both normal and non-normal distribution via the sampling of multiple dependent states
● An overview of attribute control charts based on memory statistics
● The development of control charts using EQMA statistics
For a solid understanding of control methodologies and the basics of quality assurance,
is a definitive reference designed to be read by practitioners and students alike. It is an essential textbook for those who want to explore quality control and systems design.
Introduction to Statistical Process Control — читать онлайн ознакомительный отрывок
Ниже представлен текст книги, разбитый по страницам. Система сохранения места последней прочитанной страницы, позволяет с удобством читать онлайн бесплатно книгу «Introduction to Statistical Process Control», без необходимости каждый раз заново искать на чём Вы остановились. Поставьте закладку, и сможете в любой момент перейти на страницу, на которой закончили чтение.
Интервал:
Закладка:
As v increases, the Student's t ‐distribution tends to a normal (0, 1) distribution.
Gamma Distribution
Yet another important probability distribution commonly used in the literature of the control charts for non‐normal random variables is the Gamma distribution. The probability distribution of the Gamma distribution can be defined as
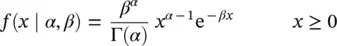
with the scale parameter β > 0 and the shape parameter α > 0.
The mean and variance of the Gamma distribution are

and

respectively (Montgomery, 2009).
Discrete Probability Distributions
Binomial Probability Distribution
Let a process consists of a set of n independent trials. Here the term independent means that any outcome is not affected by the previous outcome whether it had occurred or not. Here we define any outcome as either success or failure. Suppose that the probability of success is denoted by p , p belongs to the interval (0,1), and the probability of failure is denoted by q = 1 − p , then the binomial probability distribution can be defined as
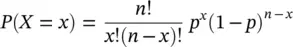
where n is the total number of independent trials and x is a binomial random variable ranging from 0 to n . This distribution has only two parameters n and p . The distribution is symmetric when  , the distribution is positively skewed if
  , and it is negatively skewed if
  .
.
The binomial probability distribution is the most commonly used distribution in the control chart literature to model the number cases in a sample of n items when the proportion in the population is known. For example, if the proportion of defective item in any mass production unit is 0.12, then find the complete binomial probability distribution for n = 10 ( Table 1.1).
Poisson Probability Distribution
The Poisson distribution is another important discrete probability distribution used for calculating the characteristics of the control chart, which identifies a given number of defects per unit; for instance, the number of stones in a piece of glass of the given size or the number of defects in the manufacturing of items, etc. This distribution has only one parameter μ .
Table 1.1 Probabilities of number of defective items using binomial distribution.
| No. of defective items | Probability | No. of defective items | Probability |
| 0 | 0.27850098 | 6 | 0.00037604 |
| 1 | 0.37977406 | 7 | 0.00002930 |
| 2 | 0.23304317 | 8 | 0.00000150 |
| 3 | 0.08474297 | 9 | 0.00000005 |
| 4 | 0.02022275 | 10 | 0.00000000 |
| 5 | 0.00330918 | Total | 1.00000000 |
The mean and standard deviation of the binomial distribution are np = 1.2 and  = 1.264911, respectively.
Table 1.2 Probabilities of number of defective items using Poisson distribution.
| No. of defective items | Probability | No. of defective items | Probability |
| 0 | 0.110803158 | 6 | 0.017448405 |
| 1 | 0.243766948 | 7 | 0.005483784 |
| 2 | 0.268143643 | 8 | 0.001508041 |
| 3 | 0.196638672 | 9 | 0.000368632 |
| 4 | 0.108151269 | 10 | 0.000081099 |
| 5 | 0.047586559 | 11 and more | 0.000019789 |
The mean and standard deviation of this distribution are μ = 2.5 and  = 1.58, respectively.
The frequency distribution of the Poisson distribution can be defined as
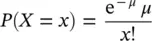
where μ = mean number of defects, μ > 0, e = 2.71828… and x = number of occurrences, x = 0, 1, 2, 3, …
Suppose that the average number of stones in a glass of a particular shape was 2.5. Find the probabilities of different number of stones in the glass. Evaluating the Poisson distribution in this case, we get the results shown in Table 1.2.
1.5 Types of Control Charts
Broadly speaking, there are two types of control charts, i.e. attribute control charts and variable control charts.
1.5.1 Attribute Control Charts
When articles or units are studied on the basis of qualitative measures as go/no go, yes/no, satisfied/not satisfied, positive/negative, etc., then an attribute control chart is suitable to monitor the unusual changes. These are the charts commonly known as p ‐chart used for monitoring proportion of nonconforming items in a sample or proportion of defective items in a sample, and np ‐chart is used to monitor the number of nonconforming items in a sample of size n .
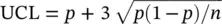
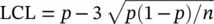
The control limits of these control charts are similar particularly when the sample size is fixed. The limits of p ‐chart charts may be constructed by using the binomial probability distribution with parameter p . As we know that the mean of the binomial distribution is np and its standard deviation is  . Thus

And the control limits for the np ‐chart can be constructed as
Читать дальшеИнтервал:
Закладка:
Похожие книги на «Introduction to Statistical Process Control»
Представляем Вашему вниманию похожие книги на «Introduction to Statistical Process Control» списком для выбора. Мы отобрали схожую по названию и смыслу литературу в надежде предоставить читателям больше вариантов отыскать новые, интересные, ещё непрочитанные произведения.


Обсуждение, отзывы о книге «Introduction to Statistical Process Control» и просто собственные мнения читателей. Оставьте ваши комментарии, напишите, что Вы думаете о произведении, его смысле или главных героях. Укажите что конкретно понравилось, а что нет, и почему Вы так считаете.