

Another attribute control chart that is commonly used in the control chart literature is the c ‐chart used for monitoring the number of nonconformities in each sample or the number of defects in each sample. The limits of c ‐chart charts may be constructed by using the Poisson probability distribution with parameter c . As we know that the mean of the Poisson distribution is c and its standard deviation is  . Thus


Yet another attribute control chart commonly used in the literature of the SPC is the μ ‐chart. It is used to monitor the nonconformity items per unit or the nonconforming items per unit. The distribution of the c ‐chart and the μ ‐chart is the same except the scale of the units, which is changed by n in the μ ‐chart. The control limits of μ ‐chart can be established as


1.5.2 Variable Control Charts
When the characteristics under study are measured on the continuous scale, such as the height, weight, time, and temperature, then such variables are classified as the continuous variables. The commonly used control charts are the average or the dispersion charts or the combination of both the charts. The  ‐chart is the most common chart developed with the association of the R ‐chart (also known as
  ‐ and R ‐chart). The development of
  ‐ and S ‐chart or S 2‐chart is also very common. These charts have been discussed thoroughly in the latter chapters. In general the distribution of all the variable control charts under study is assumed to be normally distributed. The three‐sigma control limits are thus computed with the false alarm rate, the probability that an observation falling outside the control limits is 0.0027. The average run length of the three‐sigma control limits can be calculated as 1/0.0027 = 370.3704, which means that on average the process indicates an out‐of‐control process after 370 samples if the distribution of observations follows exactly the normal distribution. This is the most commonly used level in evaluating and comparing the process in the control chart literature. The concept of three‐sigma control limits is commonly accepted by the industry, which is easy to understand, and applied by the quality control personnel. The variable control limits can be developed using the pre‐specified constant values given in Appendix B.
1.6 Meaning of Process Control
The term process control is used to keep the process in control. In statistical terminology a graphical method of presenting a sequence of samples on a chart is called control chart, a tool used for monitoring different changes in the process. A typical control chart has been given in Figure 1.6.
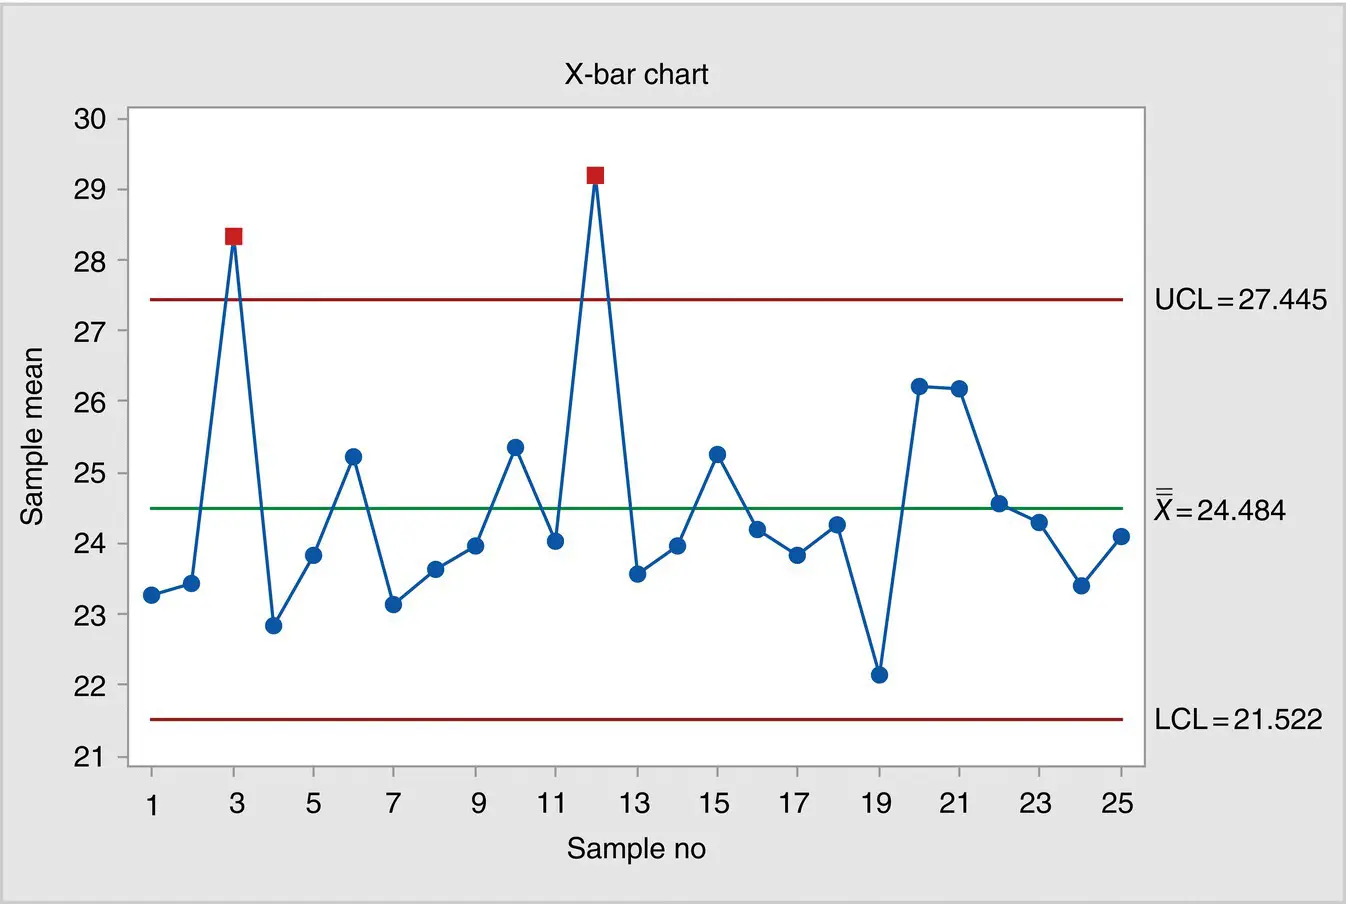
Figure 1.6 Plotting of typical control chart.
1 Ahmad, L., Aslam, M., & Jun, C.‐H. (2014). Designing of X‐bar control charts based on process capability index using repetitive sampling. Transactions of the Institute of Measurement and Control, 36(3), 367–374.
2 Aslam, M., Srinivasa Rao, G., Ahmad, L., & Jun, C.‐H. (2017). A control chart for multivariate Poisson distribution using repetitive sampling. Journal of Applied Statistics, 44(1), 123–136. doi:10.1080/02664763.2016.1164837
3 Garvin, D. (1987). Competing on the eight dimensions of quality. Harvard Business Review, 65(6), 101–109.
4 Montgomery, C. D. (2009). Introduction to statistical quality control (6th ed.). New York, NY: Wiley.
5 Oakland, J. S. (2008). Statistical process control (6th ed.). Oxford, UK: Butterworth‐Heinemann.
1 Preamble: Some basic concepts regarding quality control and statistics are described before understanding the concepts and techniques in the forthcoming chapters.
Конец ознакомительного фрагмента.
Текст предоставлен ООО «ЛитРес».
Прочитайте эту книгу целиком, на ЛитРес.
Безопасно оплатить книгу можно банковской картой Visa, MasterCard, Maestro, со счета мобильного телефона, с платежного терминала, в салоне МТС или Связной, через PayPal, WebMoney, Яндекс.Деньги, QIWI Кошелек, бонусными картами или другим удобным Вам способом.


 . Thus


 ‐chart is the most common chart developed with the association of the R ‐chart (also known as
  ‐ and R ‐chart). The development of
  ‐ and S ‐chart or S 2‐chart is also very common. These charts have been discussed thoroughly in the latter chapters. In general the distribution of all the variable control charts under study is assumed to be normally distributed. The three‐sigma control limits are thus computed with the false alarm rate, the probability that an observation falling outside the control limits is 0.0027. The average run length of the three‐sigma control limits can be calculated as 1/0.0027 = 370.3704, which means that on average the process indicates an out‐of‐control process after 370 samples if the distribution of observations follows exactly the normal distribution. This is the most commonly used level in evaluating and comparing the process in the control chart literature. The concept of three‐sigma control limits is commonly accepted by the industry, which is easy to understand, and applied by the quality control personnel. The variable control limits can be developed using the pre‐specified constant values given in Appendix B.


