1 Cover
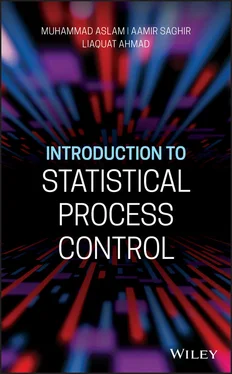
2 Title Page Introduction to Statistical Process Control Muhammad Aslam Aamir Saghir Liaquat Ahmad
3 Copyright Page
4 About the Authors
5 Preface
6 Acknowledgments
7 1 Introduction and Genesis1.1 Introduction 1.2 History and Background of Control Charts 1.3 What Is Quality and Quality Improvement? 1.4 Basic Concepts 1.5 Types of Control Charts 1.6 Meaning of Process Control References
8 2 Shewhart Type Control Charts for Attributes 2.1 Proportion and Number of Nonconforming Charts 2.2 Number of Nonconformities and Average Nonconformity Charts 2.3 Control Charts for Over‐Dispersed Data 2.4 Generalized and Flexible Control Charts for Dispersed Data 2.5 Other Recent Developments References
9 3 Variable Control Charts3.1 Introduction 3.2  Control Charts 3.3 Range Charts 3.4 Construction of S ‐Chart 3.5 Variance S 2‐Charts References
10 4 Control Chart for Multiple Dependent State Sampling4.1 Introduction 4.2 Attribute Charts Using MDS Sampling 4.3 Conway–Maxwell–Poisson (COM–Poisson) Distribution 4.4 Variable Charts 4.5 Control Charts for Non‐normal Distributions 4.6 Control Charts for Exponential Distribution 4.7 Control Charts for Gamma Distribution References
11 5 EWMA Control Charts Using Repetitive Group Sampling Scheme5.1 Concept of Exponentially Weighted Moving Average(EWMA) Methodology 5.2 Attraction of EWMA Methodology in Manufacturing Scenario 5.3 Development of EWMA Control Chart for Monitoring Averages 5.4 Development of EWMA Control Chart for Repetitive Sampling Scheme 5.5 EWMA Control Chart for Repetitive Sampling Using Mean Deviation 5.6 EWMA Control Chart for Sign Statistic Using the Repetitive Sampling Scheme 5.7 Designing of a Hybrid EWMA (HEWMA) Control Chart Using Repetitive Sampling References
12 6 Sampling Schemes for Developing Control Charts6.1 Single Sampling Scheme 6.2 Double Sampling Scheme 6.3 Repetitive Sampling Scheme 6.4 Mixed Sampling Scheme 6.5 Mixed Control Chart Using Process Capability Index References
13 7 Memory‐Type Control Charts for Attributes7.1 Exponentially Weighted Moving Average (EWMA) Control Charts for Attributes 7.2 CUSUM Control Charts for Attributes 7.3 Moving Average (MA) Control Charts for Attributes References
14 8 Multivariate Control Charts for Attributes8.1 Multivariate Shewhart‐Type Charts 8.2 Multivariate Memory‐Type Control Charts 8.3 Multivariate Cumulative Sum (CUSUM) Schemes References
15 Appendix A: Areas of the Cumulative Standard Normal Distribution
16 Appendix B: Factors for Constructing Variable Control Charts
17 Index
18 End User License Agreement
1 Chapter 1 Table 1.1 Probabilities of number of defective items using binomial distribut... Table 1.2 Probabilities of number of defective items using Poisson distributi...
2 Chapter 2 Table 2.1 The number of defective tires in tire manufacturing plant.Table 2.2 Calculations of β function for p‐ chart with n = 20, LCL =...Table 2.3 The number of nonconformities per 1000 m in telephone cable.Table 2.4 The imperfection in finished rolls of paper.Table 2.5 The β values of c‐ chart with UCL = 33.22 and LCL = 6.48....Table 2.6 The average run length of the g ‐chart for p 0= 0.20 and n = 5.Table 2.7 The number of orders on each truck.Table 2.8 Control limits for total number of events and average number of eve...Table 2.9 Some numerical values of ARL for θ 0= 0.01, λ 0= 0.8, and Table 2.10 Control limits for total number of events and average number of ev...Table 2.11 Control chart multiple k required to achieve α = 0.0020 for CO...Table 2.12 Control chart multiple k required to achieve α = 0.0020 for CO...Table 2.13 False alarm probability example for COM–Poisson chart.
3 Chapter 3Table 3.1 Net weight (in ounce) of a dry bleach product.Table 3.2 Construction of  chart for capability index under the repetitive sa...Table 3.3 ARL 1values using the sample sizes n = 5, 10, and 20 when r 0= 200,...Table 3.4 Neutrosophic ARL (NARL) values for chart parameters n Nɛ{3, 4} and r 0...Table 3.5 Neutrosophic ARL (NARL) values for chart parameters n Nɛ{4, 6} and r 0...Table 3.6 Neutrosophic ARL (NARL) values for chart parameters n Nɛ{9, 10} and r Table 3.7 Average run length values for ARL 0= 300 (Maedh et al., 2017).Table 3.8 Average run length values for ARL 0= 370 (Maedh et al., 2017).
4 Chapter 4Table 4.1 ARL 1of the proposed control chart for r 0= 370 (Aslam, Nazir, et a...Table 4.2 ARL 1of the proposed control chart for r 0= 300 (Aslam, Nazir, et a...Table 4.3 ARLs of proposed chart when v = 0.50, μ 0= 3, and ARL 0= 200 (A...Table 4.4 ARLs of proposed chart when v = 0.50, μ 0= 4, and ARL 0= 200 (Asl...Table 4.5 ARLs of proposed chart when v = 0.50, μ 0= 4, and ARL 0= 500 (A...Table 4.6 ARL comparison between the proposed and Saghir and Lin charts when v Table 4.7 ARL 1for the proposed chart when r 0= 370 (Aslam et al., 2014).Table 4.8 Comparisons of ARL 1for both charts r 0= 370 (Aslam et al., 2014)....Table 4.9 ARLs of the proposed control chart when r 0= 370 (Aslam, Azam, et al...Table 4.10 ARL 1values for the proposed chart with i = 2 when r 0= 370 (Aslam...Table 4.11 ARL 1values for the proposed chart with i = 3 when r 0= 370 (Aslam...Table 4.12 Comparison of ARL 1values for proposed chart with i = 3 and Shewha...
5 Chapter 5Table 5.1 RL characteristics of the EWMA‐MD chart under repetitive sampling f...Table 5.2 RL characteristics of the EWMA‐MD chart under repetitive sampling for ...Table 5.3 RL characteristics of the EWMA‐MD chart under repetitive sampling for Table 5.4 RL characteristics of the EWMA‐MD chart under repetitive sampling for Table 5.5 RL characteristics of the EWMA‐MD chart under repetitive sampling for ...Table 5.6 RL characteristics comparison of the proposed vs. the existing EWMA...Table 5.7 Estimation of control chart coefficients K 1and K 2.Table 5.8 ARL values of the single sampling scheme.Table 5.9 Example of soft drink (Montgomery, 2009).Table 5.10 ARL 1of the proposed chart when λ 1= 0.10 and λ 2= 0.25....Table 5.11 ARL 1of the proposed chart when λ 1= 0.10 and λ 2= 0.50....Table 5.12 ARL 1of the proposed chart when λ 1= 0.10 and λ 2= 0.25....Table 5.13 ARL comparison of proposed control chart with Haq (2013) when λ 1Table 5.14 Simulated data for the application.
6 Chapter 6Table 6.1 Data for the hard bake process of flow width measurements (Montgome...Table 6.2 Data for the calorific values (Elevli, 2006).Table 6.3 Data for the moisture content values (Elevli, 2006).Table 6.4 Data for the ash content values (Elevli, 2006).Table 6.5 The hypothetical 30 observations from the gamma distribution (Khan,...Table 6.6 Transformation of the hypothetical 30 observations from the gamma d...Table 6.7 Transformation of the urinary tract infection from Santiago and Smi...Table 6.8 Values of ARL for p = 0.05.Table 6.9 Values of ARL for p = 0.10.Table 6.10 Values of ARL for p = 0.20.Table 6.11 Values of ARL for p = 0.30.Table 6.12 Values of ARL for p = 0.50.
7 Chapter 7Table 7.1 Comparison of the ARLs of the upper‐sided Shewhart and modified EWM...Table 7.2 Values of ARL of ISRT
Читать дальше

 Control Charts 3.3 Range Charts 3.4 Construction of S ‐Chart 3.5 Variance S 2‐Charts References
 chart for capability index under the repetitive sa...Table 3.3 ARL 1values using the sample sizes n = 5, 10, and 20 when r 0= 200,...Table 3.4 Neutrosophic ARL (NARL) values for chart parameters n Nɛ{3, 4} and r 0...Table 3.5 Neutrosophic ARL (NARL) values for chart parameters n Nɛ{4, 6} and r 0...Table 3.6 Neutrosophic ARL (NARL) values for chart parameters n Nɛ{9, 10} and r Table 3.7 Average run length values for ARL 0= 300 (Maedh et al., 2017).Table 3.8 Average run length values for ARL 0= 370 (Maedh et al., 2017).


