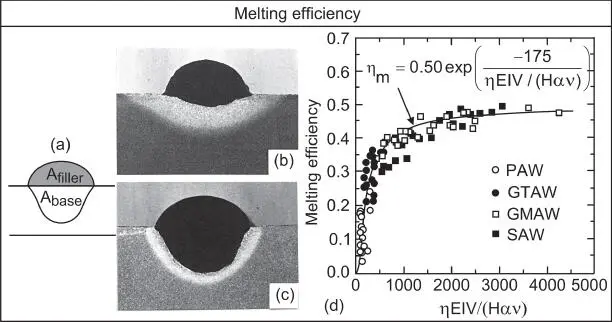
Figure 2.9Melting efficiency: (a) transverse weld cross section; (b) lower heat input and welding speed; (c) higher at higher heat input and welding speed; (d) variation with dimensionless parameter ηEIV/Hαv.
Source : DuPont and Marder [7]. Welding Journal, December 1995, © American Welding Society
.
Figures 2.9b,c show the transverse cross‐sections of two steel welds differing in the melting efficiency [7]. Here, EI = 3825 W and V = 10 mm/s for the shallower weld of lower melting efficiency ( Figure 2.9b) and EI = 10 170 W and V = 26 mm/s for the deeper weld of higher melting efficiency ( Figure 2.9c). Note that the ratio EI/V is about the same in the two cases.
Fuerschbach and Knorovsky [5] proposed the following empirical equation for the melting efficiency:
(2.5) 
where A and B are constants, H = H base+ H filler, α is the thermal diffusivity, and v is the kinematic viscosity of the weld pool. The results of DuPont and Marder [7] shown in Figure 2.9d confirm the validity of Eq. (2.5). As the dimensionless parameter η EIV/(Hαν) increases, the melting efficiency increases rapidly first and then levels off. If the arc efficiency η is known, η EIV/(Hαν) is also known and the melting efficiency can be predicted from Figure 2.9. With the help of the following equation for determining A filler, A basecan then be calculated from Eq. (2.4):
(2.6) 
or
(2.7) 
In the above equations, R fillerand V fillerare the radius and feeding speed of the filler metal, respectively. The left‐hand side of Eq. (2.6) is the volume of the weld metal contributed by the filler metal and the right‐hand side is the volume of filler metal used during welding.
It should be noted that the melting efficiency cannot be increased indefinitely by increasing the welding speed without increasing the power input. To do so, the power input must be increased along with the welding speed. It should also be noted that in the presence of a surface‐active agent such as sulfur in steel, the weld pool can become much deeper even though the welding parameters and physical properties in Eq. (2.5) remain unchanged ( Chapter 3).
2.1.3 Power Density Distribution of Heat Source
2.1.3.1 Effect of Electrode Tip Angle
In GTAW with DCEN, the shape of the electrode tip affects both the shape and power density distribution of the arc. As illustrated in Figure 2.10, as the electrode tip becomes blunter, the arc becomes more constricted, and the power density distribution increases. Glickstein [15] showed in Figure 2.11that the arc becomes more constricted as the conical tip angle of the tungsten electrode increases.
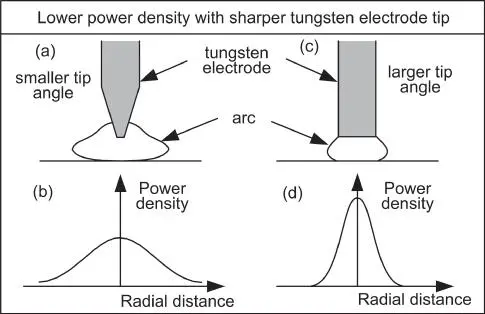
Figure 2.10Effect of electrode tip angle on shape and power density distribution of gas–tungsten arc.
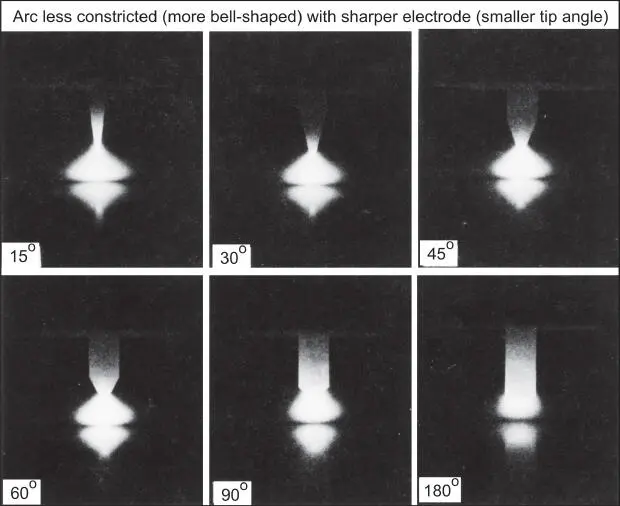
Figure 2.11Effect of electrode tip angle on shape of gas–tungsten arc.
Source : Glickstein [15]. Welding Journal, August 1976, © American Welding Society.
Savage et al. [16] observed that, under the same welding current, speed, and arc gap, the weld depth–width ratio increases with increasing vertex angle of the conical tip of the tungsten electrode. Key [17] reported a similar effect of the tip angle, at least with Ar shielding, as shown in Figure 2.12.

Figure 2.12Effect of electrode tip geometry on shape of gas–tungsten arc welds in stainless steel (pure Ar, 150 A, 2.0 s, spot‐on‐plate).
Source : Drawn from photos of Key [17]. Welding Journal, December 1980, © American Welding Society.
Several investigators have measured the power density distribution (and current density distribution) in the gas−tungsten arc by using the split‐anode method [318–20]. Figure 2.13shows the results of Tsai [20] and Lu and Kou [3], which can be represented by the Gaussian‐type distribution [21–23].
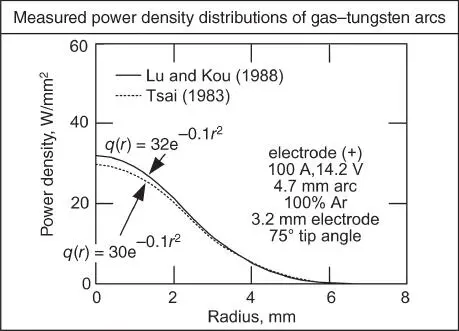
Figure 2.13Measured power density distributions.
Source : Lu and Kou [3]. Welding Journal, February 1988, © American Welding Society.
2.2 Heat Flow During Welding
2.2.1 Response of Material to Welding Heat Source
Before proceeding to discuss analytical equations for heat flow in the workpiece, it is worthwhile to consider the response of the material in the workpiece to the welding heat source, such as the material in the heat‐affected zone (HAZ). Figure 2.14a shows the positions of a weld pool (which is moving from left to right) at three different moments of time. Let T Lbe the temperature at which the workpiece material melts completely during heating and T Hbe the temperature at which the solid‐state transformation occurs during heating. Thus, the region of the workpiece scanned by the T Lisotherm (i.e. the pool boundary) is the fusion zone. The region of the workpiece scanned by the T Hisotherm, excluding the weld pool and the fusion zone, is the HAZ.
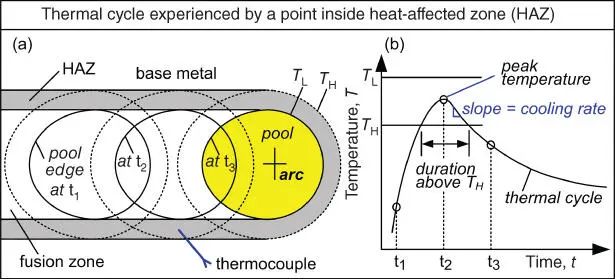
Figure 2.14HAZ thermal cycle: (a) top view of weld pool, fusion zone (solidified material behind pool) and HAZ (material next to pool and fusion zone); (b) thermal cycle recorded with a thermocouple inside HAZ during welding.
A thermocouple is prepositioned inside the HAZ. As shown in Figure 2.14b, it detects a temperature well below T Hat time t 1, a peak temperature between T Land T Hat time t 2, and a temperature below T Hat time t 3. The temperature‐time curve experienced at a location in the workpiece during welding, such as that shown in Figure 2.14b, is called the thermal cycle . The thermal cycle of the HAZ provides information such as the peak temperature (how close to T L), the duration above T Hand the cooing rate, which are useful for better understanding of the HAZ microstructure and properties. Likewise, the thermal cycle of the fusion zone, which shows a peak temperature above T L, provides information useful for studying the fusion‐zone solidification microstructure and properties.
Читать дальше
